National Multidimensional Poverty Analysis and Index in Sri Lanka
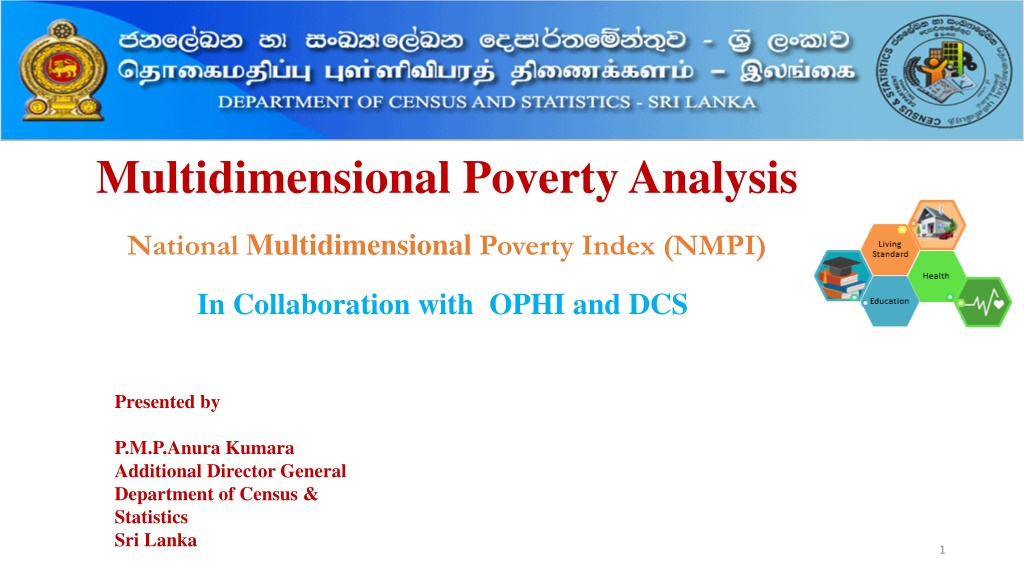
The National Multidimensional Poverty Index (NMPI) in Sri Lanka, developed in collaboration with OPHI and DCS, is presented by P.M.P. Anura Kumara. The Alkire and Foster method is used to analyze and measure poverty, considering various dimensions and indicators such as education, health, standard of living, and women empowerment. The index reflects the multiple deprivations individuals face simultaneously. Key statistics include the incidence, intensity, and composition of poverty based on different indicators.

Download Presentation

Please find below an Image/Link to download the presentation.
The content on the website is provided AS IS for your information and personal use only. It may not be sold, licensed, or shared on other websites without obtaining consent from the author. Download presentation by click this link. If you encounter any issues during the download, it is possible that the publisher has removed the file from their server.
E N D
Presentation Transcript
Multidimensional Poverty Analysis National Multidimensional Poverty Index (NMPI) In Collaboration with OPHI and DCS Presented by P.M.P.Anura Kumara Additional Director General Department of Census & Statistics Sri Lanka 1
Alkire and Foster Method An MPI reflects the multiple deprivations each person faces at the same time. The MPI dashboard s key statistics include: Incidence of poverty: The percentage of multi dimensionally poor people. Intensity of poverty: The average proportion of deprivations poor people face at once. Composition of poverty: The percentage of people who are poor and deprived in each indicator.
Dimensions and Indicators of National Multidimensional Index Sri Lanka 13 Indicators Safe drinking Bank account School items consumption Nutrition of Health Nutrition of Schooling Year of Sanitation Employed Access to pollution Tobacco Housing Indoor Assets Standard of living media water adult child Not Women empowerment Education 4 Dimensions 4
Dimensions (4), Indicators(13), and Weights of National MPI Dimensions (4), Indicators(13), and Weights of National MPI Dimension (Weight) Education (1/4) Indicator (Weight) Year of Schooling (1/8) Deprivation cut-off A household is deprived in schooling if No household member (16 years and above) has completed ten years of schooling A household is deprived in School items if any school age child hasn't enough school books, shoes and uniform A household is deprived if any member smoke or chew tobacco on a daily basis School items (1/8) Health ((1/4) Smoking Tobacco consumption (1/12) Nutrition of adult (1/12) A household is deprived in nutrition if any adult in the household with nutritional information is low BMI or high BMI A household is deprived in nutrition if any child in the household is undernourished Nutrition of child (1/12) Standard of living (1/4) A household is deprived in housing if construction materials of are semi-permanent ( floor, wall, and roof) A household is deprived in sanitation if the household's sanitation facility is not improved or it is shared with other households Housing (1/20) Sanitation (1/20) A household is deprived in water if the household does not have access to safe drinking water or safe water is more than 15-minute walk Safe drinking water (1/20) A household is deprived if smoke coming to inside the household Indoor pollution (1/20) Household does not own at most one radio: telephone, TV, bike, motorbike or refrigerator and does not own a car/van/Jeep/bus/lorry/motor boat or truck A household is deprived if female haven't a bank account A household is deprived if female does not access to media A household is deprived if female does not work Assets (1/20) Women empowerment (1/4) Bank account (1/12) Access to media (1/12) Employment (1/12)
Distribution of general and multidimensionally poor population by sector-2016 The poor population share is 90.0 79.5 MPI poor 78.6 higher than the general population 80.0 Percentage of population(%) Total population 70.0 share in estate sector. 60.0 50.0 In rural sector also share of poor 40.0 30.0 population is slightly higher that 17.4 20.0 12.0 8.5 that of general population. 10.0 4.1 0.0 Rural Urban Sector Estate
Multidimensional Poverty Index (MPI) by district Multidimensional Poverty Index (MPI) by district 25 Variation across districts 20 15 National 10 5 0 Polonnar Trincomal Monarag Anuradha Hambant Nuwaraeli Mannar Ampara Matale Kurunegala Kandy Vavuniya Batticaloa Puttalam Gampaha Mullaitivu Ratnapura Kegalle Badulla Jaffna Kalutara Galle Killinochchi Matara Colombo Sri Lanka District
Headcount Ratios by indicator Headcount Ratios by indicator - -2016 2016 Indoor pollution and deprivation eligible employment the higher headcount index than indicators 30.0 of Vari atio n acro ss Indi cato rs Percentage of poor and deprived population (%) women shows 25.0 20.0 other 15.0 10.0 5.0 The headcount reported tobacco consumption. third highest has from 0.0 TC NA NC YS SI IP AS SDW HS SN EM BA AM Health Education Standard of living Women empowerment The percentage share of population who are multidimensionally poor and deprived in each dimensions.
Contributionof each Dimension to National MPI Deprivation of Health, Women Empowerment Standard more or less equally contribute to National MPI and lowest contribution from Education Education, 14.2% Women Empower ment, 28.2% and Living Health, 29.7% reported Living Standard, 27.9%
Percentage Contribution of Each Percentage Contribution of Each Indicator to national MPI, 2016 to national MPI, 2016 The highest contribution is given by women employment and second highest is tobacco consumption and third highest is indoor pollution. The lowest contribution is given by sanitation.
Percentage Contribution of Each Indicator to national MPI by sector Percentage Contribution of Each Indicator to national MPI by sector - - 2016 2016 100% The graph depicts that in urban and rural deprivation of women employment poverty is higher than other indicators 90% 80% 70% Percentatge(%) contribute to 60% 50% 40% 30% 20% In estate sector the highest contributing indicator for poverty is year of schooling. 10% 0% Urban Rural Estate Housing 1.8 2.7 10.1 Sanitation 3.0 2.8 3.5 Access to media 3.7 4.1 1.6 School items 4.7 5.1 3.6 The second highest contribution to poverty in all three sectors is deprivation consumption. Assets 5.0 5.3 10.0 Safe drinking water 1.2 5.6 8.6 Bank account 11.2 7.3 6.2 Nutrition of child 8.8 7.5 6.2 of tobacco Nutrition of adult 11.7 7.7 5.2 Year of Schooling 8.6 8.7 16.0 Indoor pollution 7.2 11.2 8.6 Tobacco consumption 13.3 14.6 14.0 Employment 19.9 17.7 7.5
Percentage Contribution of Each Indicator to national MPI by District 2016 Percentage Contribution of Each Indicator to national MPI by District 2016 Women Employment (20.7%) The contribution of year of schooling is high in the districts Puttalama(14.1%), Mannar (13.6%),Trincomalee (13.0%), Nuwaraeliya(12.9 100% 90% 80% The highest contribution to overall poverty by school items is reported from Batticaloa district (11.5%). School items 11.5% 70% Percentage contribution(%) Tobacco Consumption (18.6%) Year of schooling 14.1% 60% 50% 40% The highest contribution of tobacco consumption is Hambantota (18.6%) Rathnapura (18.1%), Kalutara (16.9%) 30% reported followed Gall from by 20% (17.3%), 10% 0% The highest contribution of women employment has been reported from Hambanthota(20.7%) Year of Schooling School items Tobacco consumption Nutrition of adult Nutrition of child Housing Safe drinking water Indoor pollution Assets Bank account Access to media Employment Indicator contribution is not alike by districts
Consumption poverty Headcount vs. Multidimensional poverty Consumption poverty Headcount vs. Multidimensional poverty Headcount Headcount Variation across districts 70.0 60.0 Percentage of population(%) 50.0 40.0 30.0 20.0 10.0 0.0 District Headcount of multidimensional poverty Consumton Poverty Headcount(H) The poorest district by multidimensional poverty is not much monetary poor Monetary poverty and Multidimensional poverty do not trend together
NATIONAL HEADCOUNT FOR CHILDREN AND OTHER ADULT POPULATION Multidimensional poverty headcount (H) by age groups-2016 60.0 50.0 Percentage of population (%) 40.0 Variation across age groups 30.0 20.0 10.0 0.0 0-9 10 - 17 18-24 25-35 36-49 50-64 65 and above 14 Age group
Conclusions The highest deprived indicator is indoor pollution ,Secondly highest is female not work mainly due to difficult to find a job and need to be home for the children and the third highest deprived indicator is tobacco consumption. NMPI is much higher in estate sector than that of other two sectors in Sri Lanka. It more than twice than rural sector. The highest National Multidimensional Poverty indices are reported from Nuwara-Eliya district and the lowest has been reported from Colombo district. The health, women empowerment and living standard dimensions more or less equally contribute to overall poverty and contribution of education to overall poverty is comparatively less than other dimensions. 15
Cont.. Among the indicators the highest contribution is given by women employment and second highest is tobacco consumption and third highest is indoor pollution. The contribution of year of schooling is high in Puttalama distict (14.1%), The highest contribution to overall poverty by school items is reported from Batticaloa district (11.5%). The highest contribution of tobacco consumption is reported from Hambantota (18.6%) Monetary poverty and Multidimensional poverty do not trend together 16
AKNOWLEDGEMENT Support Provided by Mrs.M.D.D.D.Deepawansa statistician Department of Census & Statistics Sri Lanka
THANK YOU 18


, Indicators(13), and Weights of National MPI")

 by district")