Analysis of Sri Lanka Air Logistics and Freight Forwarders Association Statistics 2018
Sri Lanka Logistics & Freight Forwarders Association's 2018 statistics reveal positive growth in air exports over the last 4 years, with a 6.09% increase in 2018 compared to 2017. Total air exports and imports details show fluctuations throughout the quarters, with 2018 full-year figures slightly lower for imports but the highest in 5 years for exports. The detailed breakdown provides insights into the performance and trends in the country's air logistics sector.

Download Presentation

Please find below an Image/Link to download the presentation.
The content on the website is provided AS IS for your information and personal use only. It may not be sold, licensed, or shared on other websites without obtaining consent from the author. Download presentation by click this link. If you encounter any issues during the download, it is possible that the publisher has removed the file from their server.
E N D
Presentation Transcript
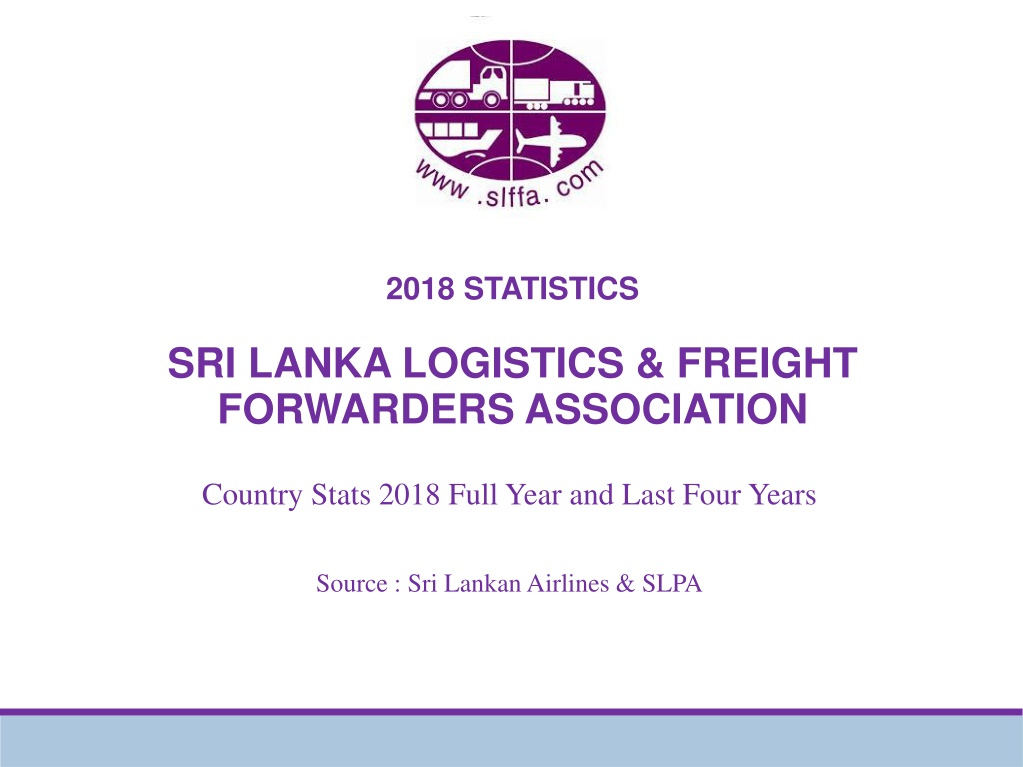
2018 STATISTICS SRI LANKA LOGISTICS & FREIGHT FORWARDERS ASSOCIATION Country Stats 2018 Full Year and Last Four Years Source : Sri Lankan Airlines & SLPA
Total Air Exports 2018 Full Year + Last 4 Years (In Tons) Total Uplifts 15,000.00 10,000.00 5,000.00 0.00 JAN FEB MAR APR MAY JUN JUL AUG SEP OCT NOV DEC 2014 2015 2016 2017 2018 2014 2015 2016 2017 2018 9,619.15 9,144.79 11,315.28 10,046.28 10,539.37 10,559.76 11,351.46 10,757.08 10,301.01 10,788.33 10,789.41 11,059.33 126,271.23 9,782.15 9,866.98 12,260.25 10,729.69 11,110.20 10,573.24 11,552.15 10,875.09 10,617.86 10,960.85 10,582.44 10,915.23 129,826.12 10,601.33 10,870.11 12,555.19 10,989.35 11,259.31 11,478.27 11,780.23 11,778.75 11,483.48 12,267.37 11,931.32 11,958.06 138,952.77 10,601.33 10,870.11 12,555.19 10,989.35 11,259.31 11,478.27 11,780.23 11,778.75 11,483.48 12,267.37 11,931.32 11,958.06 138,952.78 14,028.34 13,801.10 16,244.86 14,901.63 14,472.57 13,375.31 14,094.70 14,868.58 13,845.34 14,457.10 14,011.27 13,894.25 171,995.03 Jan Feb Mar Apr May Jun Jul Aug Sep Oct Nov Dec TOTAL 2018 Full Year Performance 2018 Full year figure is the highest during past 5 years & compared to 2017, the increase is 6.09%. Significant improvement of air exports compared to recent history
Total Air Exports 2018 full year and last 4 years (In Tons) Quarterly 42,362.61 44,520.37 36,156.75 32,458.51 32,637.07 42,808.61 43,418.46 35,042.46 33,045.09 32,409.55 42,749.50 37,700.31 33,726.93 32,413.13 31,145.40 44,074.30 36,475.56 34,026.63 31,909.38 30,079.22 2014 2015 2016 2017 2018 1st Quarter 2nd Quarter 3rd Quarter 4th Quarter 2014 2015 2016 2017 2018 1st Quarter 30,079.22 31,909.38 34,026.63 36,475.56 44,074.30 2nd Quarter 31,145.40 32,413.13 33,726.93 37,700.31 42,749.50 3rd Quarter 32,409.55 33,045.09 35,042.46 43,418.46 42,808.61 4th Quarter 32,637.07 32,458.51 36,156.75 44,520.37 42,362.61 TOTAL 126,271.24 129,826.11 138,952.77 162,114.70 171,995.02 2018 Full Year Performance The improvement of 2018 took place in Q1 and Q2 which then in fact reduced compared to 2017.
Total Air Imports 2018 Full Year and Last 4 Years (In Tons) Total Discharge 7,000.00 6,000.00 5,000.00 4,000.00 3,000.00 2,000.00 1,000.00 0.00 JAN FEB MAR APR MAY JUN JUL AUG SEP OCT NOV DEC 2014 2015 2016 2017 2018 2014 2015 2016 2017 2018 3,043.23 2,399.86 3,707.14 2,814.07 3,353.11 3,233.05 3,243.01 3,203.97 3,634.51 4,004.78 4,091.84 3,867.86 40,596.43 3,429.92 3,120.15 4,183.99 3,298.26 3,859.04 3,795.06 3,870.49 3,697.21 3,961.04 4,686.75 4,439.48 4,232.48 46,573.86 4,085.15 3,848.90 5,644.30 4,310.27 5,458.26 6,057.82 5,064.26 4,844.06 4,966.18 5,789.04 5,407.82 5,366.05 60,842.10 4,085.15 3,848.90 5,644.30 4,310.27 5,458.26 6,057.82 5,064.26 4,844.06 4,966.18 5,789.04 5,407.82 5,366.05 60,842.10 4,649.34 4,104.60 4,852.32 4,055.56 4,774.01 4,757.45 5,526.74 5,252.79 5,251.96 5,539.59 5,228.63 5,278.39 59,271.38 Jan Feb Mar Apr May Jun Jul Aug Sep Oct Nov Dec TOTAL Full Year Performance 2018 Full Year figure is slightly lower than 2017 and the drop is -1.27%. Similar performance in 2018 and 2017
Total Air Imports 2018 full year and last 4 years (In Tons) Quarterly 16,562.90 16,052.10 16,046.61 13,358.71 14,874.50 15,324.50 16,031.50 11,964.48 11,528.73 10,081.49 13,993.52 15,826.35 13,587.01 10,952.36 9,400.23 14,665.93 13,606.26 13,578.36 10,734.07 9,150.23 2014 2015 2016 2017 2018 1st Quarter 2nd Quarter 3rd Quarter 4th Quarter 2014 2015 2016 2017 2018 1st Quarter 9,150.23 10,734.07 13,578.36 14,665.93 13,606.26 2nd Quarter 9,400.23 10,952.36 15,826.35 13,993.52 13,587.01 3rd Quarter 10,081.49 11,528.73 14,874.50 15,324.50 16,031.50 4th Quarter 11,964.48 13,358.71 16,562.90 16,052.10 16,046.61 TOTAL 40,596.43 46,573.87 60,842.11 60,036.05 59,271.39 Full Year Performance Quarterly comparison is almost the same between 2017 and 2018
Total Air Transshipments in 2018 Full Year and Last 4 Years (In Tons) Quarterly 10,815.24 13,320.18 10,011.97 8,870.78 11,380.16 12,036.99 10,304.68 7,998.68 12,720.85 10,348.89 9,482.16 10,766.31 12,560.46 9,526.23 9,174.83 8,266.84 2015 2016 2017 2018 1st Quarter 2nd Quarter 3rd Quarter 4th Quarter 2014 2015 2016 2017 2018 1st Quarter 6,297.50 9,526.23 9,174.83 8,266.84 12,560.46 2nd Quarter 8,112.81 9,482.16 10,348.89 10,766.31 12,720.85 3rd Quarter 9,162.56 7,998.68 10,304.68 12,036.99 11,380.16 4th Quarter 9,216.15 8,870.78 10,011.97 13,320.18 10,815.24 TOTAL 32,789.02 35,877.85 39,840.37 44,390.31 47,476.71 2018 Full Year Performance 2018 Full Year figure is the highest during past 5 years & compared to 2017, the increase is 6.95%. The transshipments have a significant increase in Q1 and Q2, meaning the total export growth in 2018 was mainly due to transshipments
Air Freight Throughput in 2018 Full Year and Last 4 Years (Exports, Imports & Transshipments) in Ton s UPLIFT (Tons) DISCHARGE (Tons) Excluding Transshipment 40,596.43 46,573.87 60,842.11 60,036.04 59,271.38 TRANSSHIPMEN T (Tons) 32,789.02 35,877.85 39,840.37 44,390.32 47,476.71 TTL (Tons) 2014 2015 2016 2017 2018 126,271.24 129,826.11 138,952.77 162,114.70 171,995.03 199,656.69 212,277.83 239,635.25 266,541.06 278,743.12 Total Air Uplift, Discharge & Transhipment 200,000.00 180,000.00 171,995.03 162,114.70 160,000.00 140,000.00 138,952.77 129,826.11 126,271.24 120,000.00 100,000.00 80,000.00 60,842.11 60,000.00 60,036.04 44,390.32 59,271.38 47,476.71 46,573.87 35,877.85 40,000.00 40,596.43 32,789.02 39,840.37 20,000.00 0.00 2014 2015 2016 2017 2018 UPLIFT (Tons) DISCHARGE (Tons) Excluding Transshipment TRANSSHIPMENT (Tons) 2018 Full Year Performance The growth of through put in 2018 is mainly due to the increase in transshipments
Total Ocean Exports 2018 Full Year and Last 4 Years (In TEU s) Annual Export Container Throughputs (TEU's) 397852 369654 360842 330899 301593 296027 287040 282812 280158 277130 2014 2015 2016 2017 2018 Laden Empty 277130 282812 280158 330899 287040 360842 296027 397852 301593 369654 Laden Empty 2018 Full Year Performance Exports out of Sri Lanka is almost the same as 2017 with no significant growth
2018 Ocean Freight Exports in TEUs 2018 Full Year and Last 4 Years - Quarterly 120000 100000 80000 60000 40000 20000 0 1ST QUARTER 2ND QUARTER 3RD QUARTER 4TH QUARTER 2016 Loading Laden 2016 Loading Empty 2017 Loading Laden 2017 Loading Empty 2018 Loading Laden 2018 Loading Empty 2016 Loading Laden 2017 Loading 2018 Loading Empty Laden Empty Laden Empty 1st Quarter 71730 89135 73785 101930 76437 103482 2nd Quarter 67977 86115 70515 92253 70265 93287 3rd Quarter 74811 84152 77725 97959 80991 87271 4th Quarter Total 2018 Full Year Performance 2018 full year Laden volume is 3.10% more than 2017 full year. Empty has reduced while laden is increased 72522 287040 101440 360842 74002 296027 105710 397852 77500 305193 85614 369654
Total Ocean Imports in 2018 Full Year and Last 4 Years (In TEU s) Annual Discharge Container Throughputs (TEU's) 650262 630514 613055 555373 506660 61043 51541 38913 38910 38388 2014 2015 2016 2017 2018 Laden Empty 506660 61043 555373 51541 613055 38913 650262 38910 630514 38388 Laden Empty 2018 Full Year Performance Laden discharge throughput is reduced in 2018 compared to 2017 numbers
2018 Ocean Freight Imports in TEUs 2018 Full Year and Last 4 Years Quarterly 180000 160000 140000 120000 100000 80000 60000 40000 20000 0 1ST QUARTER 2ND QUARTER 3RD QUARTER 4TH QUARTER 2016 Discharging Laden 2016 Discharging Empty 2017 Discharging Laden 2017 Discharging Empty 2018 Discharging Laden 2018 Discharging Empty 2016 2017 2018 Discharging Laden 151329 143257 152054 166415 613055 Discharging Laden 167929 147825 161755 172753 650262 Discharging Empty 11486 8145 10951 8331 38913 Empty 9698 8351 12685 8176 38910 Laden 170160 150753 155745 153856 630514 Empty 9113 8395 11263 9617 38388 1st Quarter 2nd Quarter 3rd Quarter 4th Quarter Total 2018 Full Year Performance 2018 full year Laden volume is 3.04% behind than 2017 full year. This could be a sign of major reduction in imports specially in Q3 and Q4
2018 Ocean Freight Transshipments in TEUs 2018 Full Year and Last 4 Years Quarterly 700000 600000 500000 400000 300000 200000 100000 0 1ST QUARTER 2ND QUARTER 3RD QUARTER 4TH QUARTER 2016 Transshipment Laden 2016 Transshipment Empty 2017 Transshipment Laden 2017 Transshipment Empty 2018 Transshipment Laden 2018 Transshipment Empty 2016 2017 2018 Transshipment Laden Transshipment Laden Transshipment Laden Empty Empty Empty 1st Quarter 467420 63632 501971 47596 577055 88620 2nd Quarter 470135 60702 516539 53162 601213 75165 3rd Quarter 505509 52986 542697 62981 633184 89294 4th Quarter Total 485869 1928933 69204 246524 552856 2114063 89642 253381 627073 2438525 105430 358509 2018 Full Year Performance Laden transshipments have increased in 2018 drastically, could be due to organic growth of the neighboring region. It is an even growth throughout the year in each quarter

")
")
")
")