
SN65DSI85-Q1 Layout Review
In-depth analysis and review of the layout design for the 2026 Nissan CDC Headunit utilizing the SN65DSI85-Q1 system. The review includes detailed information on various layers such as Layer1 to Layer10, the schematic representation, and the block diagram outlining the PMIC Cluster ASIL-B setup. Key
0 views • 13 slides

Probability, Venn Diagrams, and Expected Values Training Spring 2019
Dive into the world of probability, Venn diagrams, and expected values with real-world scenarios involving dogs in a kennel, veterinary study data analysis, conditional probabilities, distribution tables, and more. Explore the concepts, calculations, and applications in a visual and engaging manner
3 views • 13 slides
Problem-solving with Venn Diagrams
Explore various Venn diagram problems involving ownership of pets, student studies, probability calculations, and set notation. Understand how to determine the shaded sections in Venn diagrams, calculate the number of people owning both cats and dogs, find the probability of selecting a student stud
1 views • 10 slides
Comprehensive Guide to 8085 Microprocessor Interrupts and Pin Diagram
Explore the PIN diagram of the 8085 microprocessor, understand interrupts, including hardware interrupts like TRAP, RST, INTR, and the classification of interrupts such as maskable, non-maskable, vectored, and more. Learn about the sequence of steps during interrupts and their significance in microp
12 views • 31 slides

Understanding HR Diagrams in Astronomy
HR diagrams, named after astronomers Hertzsprung and Russell, depict stars' properties and relationships. The main sequence in the diagram shows where stars lie while fusing hydrogen to helium in their core. Learn about different types of stars and their positions on the diagram. Explore the signifi
0 views • 27 slides

The Joy of Sets: Graphical Alternatives to Euler and Venn Diagrams
Graphical representations of set membership can be effectively portrayed using alternatives to traditional Euler and Venn diagrams. Learn about upset plots, indicating set membership graphically, and the use of Venn or Euler diagrams as solutions. Explore the historical context and challenges with V
2 views • 43 slides

Comprehensive Guide to Electric Circuits and Circuit Diagram Interpretation
Explore the fundamentals of electric circuits, circuit components, and diagram interpretation. Learn about series and parallel circuits, resistors, sources, switches, transducers, and more. Discover how to calculate resistance, current, and potential difference in circuits. Gain insights into diodes
2 views • 76 slides

Math Quiz and Venn Diagrams
Venn diagrams for sorting numbers, probability calculations, the concept of angles in straight lines, and various math questions including factors, multiples, ratios, and conversion between 12-hour and 24-hour clocks are discussed in this educational content. The content also illustrates scenarios w
0 views • 25 slides

Interactive Lesson on Venn Diagrams and Shading Regions
Dive into a comprehensive tutorial on Venn diagrams highlighting the process of populating and shading regions. Access engaging resources, visual aids, and practice exercises to enhance your understanding. Test your knowledge with a quiz on Hegarty Maths and solidify your skills in displaying sets w
0 views • 15 slides
Understanding Two-Way Tables and Venn Diagrams in Probability
Exploring the concepts of two-way tables and Venn diagrams in probability, this lesson delves into finding probabilities using these tools. Whether dealing with mutually exclusive or non-mutually exclusive events, the addition rule is applied to calculate probabilities accurately. Illustrated with e
0 views • 21 slides

Comprehensive Guide to IEC1131-3 Ladder Diagram Programming
The origins of ladder diagram programming trace back to the graphical representation of electrical control systems, evolving from relay logic to logic circuits and finally incorporating CPUs for control decisions. A ladder diagram consists of rungs containing input and output instructions, executing
0 views • 21 slides
Understanding Sets with Venn Diagrams in Junior Certificate Ordinary Level Mathematics
Dive into the world of sets and Venn diagrams with this educational content designed for Junior Certificate Ordinary Level students. Explore shading regions, identifying subsets, and solving problems using Venn diagrams to enhance your mathematical skills.
1 views • 28 slides
Advanced Diagram Development and Management Project Summary
The Advanced Diagram Development and Management project aims to integrate a software architecture for inputting data and automating the process of developing and managing functional diagrams in naval shipbuilding. The project goals include reducing labor costs, minimizing errors on drawings, and enh
1 views • 28 slides

Understanding Scatter Diagram Method for Correlation Analysis
Scatter Diagram Method is a simple and effective way to study the correlation between two variables. By plotting data points on a graph, it helps determine the degree of correlation between the variables. Perfect positive and negative correlations, as well as high and low degrees of correlation, can
0 views • 11 slides
Understanding Fishbone Diagrams: A Visual Problem-Solving Tool
Learn about the Fishbone Diagram, also known as the Cause and Effect Diagram, its purpose, construction, and how it helps in identifying and analyzing the root causes of a problem through a structured approach. This visual tool aids in brainstorming ideas, categorizing causes, and understanding the
0 views • 14 slides
Exploring Jablonski Diagram and Smart Teaching Tools at Christian Eminent College
Delve into the world of Jablonski Diagram through a comprehensive e-content prepared by Prof. Minakshi Panwar at Christian Eminent College, Indore. Understand energy states, spin, and spin multiplicity in molecules. Discover the concepts of absorbance, non-radiative transitions, and the conversion o
0 views • 11 slides
Understanding Probability through Venn Diagrams in Practice Questions
Explore various practice questions related to probability using Venn diagrams. From shading regions to calculating probabilities of events, these questions provide a visual and conceptual understanding of probability theory. Topics include intersections, unions, complements, and more.
0 views • 42 slides
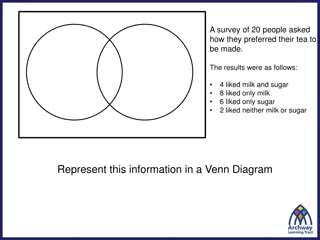
Survey Results on Tea Preferences Among 20 People
A survey of 20 people revealed that 4 liked milk and sugar in their tea, 8 preferred only milk, 6 favored only sugar, and 2 liked neither milk nor sugar. The information is represented in a Venn diagram. Additionally, the probability of a randomly chosen person preferring milk is 12/20. The probabil
0 views • 18 slides
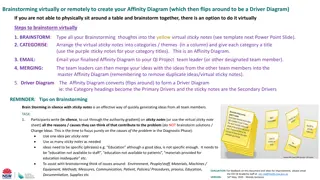
Virtual Affinity Diagram Creation for Remote Collaboration
When physical brainstorming sessions are not possible, teams can utilize virtual tools to create an Affinity Diagram remotely. Participants can brainstorm ideas on virtual sticky notes, categorize them, email the finalized diagram to team leaders, and then merge ideas into a Driver Diagram. This pro
0 views • 4 slides
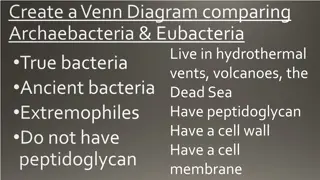
Comparison of Archaebacteria & Eubacteria Venn Diagram
Archaebacteria and Eubacteria are two types of bacteria with distinct characteristics. Archaebacteria are ancient bacteria that are extremophiles, living in harsh environments like hydrothermal vents and volcanoes, lacking peptidoglycan. On the other hand, Eubacteria are true bacteria with peptidogl
0 views • 60 slides
Exploring Victorian Times through Art: A Comparative Analysis of Aneurin Jones and Nicholas Evans' Works
In this interactive lesson, students examine the art of Welsh artists Aneurin Jones and Nicholas Evans to understand the life of workers during Victorian times. Through analyzing colors, tones, emotions, and gestures in the paintings, students gain insight into the era's social context. The lesson i
0 views • 14 slides

Understanding Set Concepts in Mathematics
Set theory is a fundamental concept in mathematics, defining sets as well-defined collections of objects with elements denoted by small letters. Properties of sets, operations on sets, and set representation using Venn diagrams are discussed. Georg Cantor's contributions to set theory and John Venn'
0 views • 17 slides

Understanding the Properties of Metals, Nonmetals, and Metalloids on the Periodic Table
Explore the distinctive properties of metals, nonmetals, and metalloids as depicted on the periodic table of elements. Discover where these elements with similar properties are located, compare their characteristics using a Venn diagram, and delve into their differences in terms of state, malleabili
0 views • 14 slides
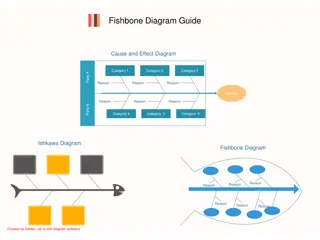
Comprehensive Guide to Fishbone Diagrams for Effective Problem-solving
The fishbone diagram, also known as the cause and effect diagram or Ishikawa diagram, is a powerful tool used to identify all possible causes of a problem in a business process. This guide covers the definition, history, benefits, and tips for creating fishbone diagrams, along with information on fi
0 views • 12 slides

Class Diagram University Degrees System
The class diagram depicts the relationships between faculties, departments, degrees, courses, and students in a university system where students enroll in courses to obtain degrees administered by specific departments. The diagram illustrates the entities and their associations within a university s
0 views • 17 slides
Understanding Venn Diagrams and Categorical Syllogisms
Venn diagrams, introduced by John Venn, visually represent relationships between different classes. Shading in diagrams signifies empty sets or no overlap between classes. Different types of categorical statements such as universal and particular are illustrated using examples. Explore how Venn diag
0 views • 30 slides
Understanding Sets and Venn Diagrams for Classification
Explore the concept of sets to categorize numbers and objects, and utilize Venn diagrams to visually represent these sets. Learn key vocabulary such as intersection, union, and complement through examples and illustrations. Practice illustrating sets and solving related questions to enhance comprehe
0 views • 21 slides
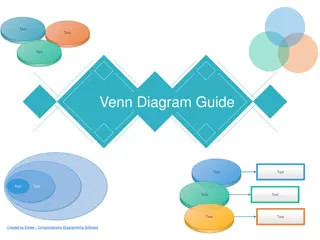
Comprehensive Guide to Venn Diagrams: Definition, History, Application, and Software
Venn diagrams illustrate relationships between sets using overlapping circles. They are versatile tools that aid in organizing abstract ideas across various disciplines. Learn about the history, applications, benefits, and user-friendly software for creating Venn diagrams efficiently. Explore exampl
0 views • 11 slides
Sorting and Grouping Objects Using Venn Diagrams
In this lesson, we explore the concept of sorting objects based on specific criteria and using Venn diagrams to group objects with shared characteristics. Tasks include listing animals, understanding sorting methods, and filling Venn diagrams with student names and food preferences. The visual aids
0 views • 12 slides

Understanding Conditional Probability and Venn's Diagram
Delve into the concepts of conditional probability and Venn's diagram, exploring how they help analyze dependent events and logical relations between sets. Learn about calculating probabilities in scenarios like different colored pencils in a box and coin toss outcomes, illustrated with examples and
0 views • 10 slides
Understanding Venn Diagrams for Sorting Shapes
A Venn diagram, composed of overlapping circles, is a useful tool for sorting objects, numbers, or shapes. This visual aid helps in categorizing shapes based on their attributes like color, sides, and properties. Through a series of interactive examples, learn how to correctly place shapes within a
0 views • 8 slides
Probability Calculations with Venn Diagrams in School and City Settings
Explore probability calculations using Venn diagrams in scenarios involving student subjects (Geography and Biology) in a secondary school and newspaper readership in a city. Understand how to calculate probabilities related to studying specific subjects, studying none of the subjects, and reading s
0 views • 9 slides

Create 3-Circle Venn Diagram Quiz Questions in Moodle
This template by Dave Foord facilitates the creation of 3-circle Venn diagram quiz questions in Moodle. It requires the drag and drop markers plugin. Users can benefit from this free resource, but A6 Training and Consultancy Ltd cannot be held liable for any potential issues. Instructions and a help
0 views • 4 slides
Understanding Venn Diagrams in Logic: Examples and Definitions
Explore Venn diagrams in logic through examples illustrating sets, key definitions, theoretical and practical examples. Understand concepts such as intersection and union of sets using numbers 0 to 9.
0 views • 50 slides

Understanding Sets and Venn Diagrams in Mathematics
Explore the basics of set theory, elements, lists, subsets, and set operations like union and intersection. Learn about Venn diagrams for visualizing sets and their subsets. Discover how sets are fundamental in mathematics and essential for further studies.
0 views • 14 slides
Solving Challenging Number System Problems Using Venn Diagrams
Practice manipulating Venn diagrams with numbers to sharpen your understanding of number systems. Insert the given numbers into the corresponding regions of the diagrams to test your knowledge and reinforce key concepts.
0 views • 25 slides

Exploring Venn Diagram Challenges in Mathematics
Delve into the world of Venn Diagram challenges in mathematics, where students engage in tasks that involve filling regions with numbers based on specified criteria. Discover the versatility and educational value of these activities while honing your analytical and problem-solving skills.
0 views • 15 slides
Understanding Probability Tables and Venn Diagrams
Probability tables serve as alternatives to Venn diagrams for visually representing probability problems. This summary explains their use, significance, and practical examples illustrating their application.
0 views • 6 slides

Understanding Sets and Venn Diagrams in Mathematics Education
Explore concepts of sets and Venn diagrams in Mathematics for 7th-grade students through engaging online classes. Learn about elements, unions, intersections, differences, and complements of sets. Practice with examples and solve problems to enhance your understanding.
0 views • 6 slides
Troubleshooting Eye Diagram Failure Issue with DP83822I in Fiber Optic Schematic
Utilizing the Tektronix MSO 70404C oscilloscope and differential probe for testing, the customer encounters failure in the eye diagram test with the DP83822 IC. Suggested solutions from the BU and potential configuration of Reg0x0027 register in DP83822I to meet the eye diagram test requirements are
0 views • 5 slides