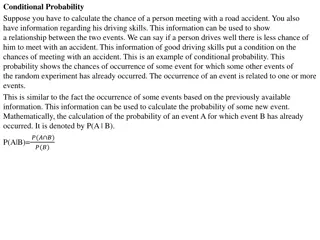
Understanding the General Multiplication Rule in Probability

Explore the General Multiplication Rule in probability, which allows you to calculate the probability of both events occurring in a chance process. Learn how to use tree diagrams, calculate conditional probabilities, and apply the rule to real-life scenarios. Dive into examples like Tim Tebow's success to grasp the concept effectively.

Download Presentation

Please find below an Image/Link to download the presentation.
The content on the website is provided AS IS for your information and personal use only. It may not be sold, licensed, or shared on other websites without obtaining consent from the author. Download presentation by click this link. If you encounter any issues during the download, it is possible that the publisher has removed the file from their server.
E N D
Presentation Transcript
Probability Lesson 4.5 The General Multiplication Rule and Tree Diagrams Statistics and Probability with Applications, 3rdEdition Starnes & Tabor Bedford Freeman Worth Publishers
The General Multiplication Rule and Tree Diagrams Learning Targets After this lesson, you should be able to: Use the general multiplication rule to calculate probabilities. Use a tree diagram to model a chance process involving a sequence of outcomes. Calculate conditional probabilities using tree diagrams. Statistics and Probability with Applications, 3rdEdition 2 2
The General Multiplication Rule and Tree Diagrams Suppose that A and B are two events resulting from the same chance process. We can find the probability P(A or B) with the general addition rule: P(A or B) = P(A) + P(B) P(A and B) How do we find the probability that both events happen, P(A and B)? General Multiplication Rule For any chance process, the probability that events A and B both occur can be found using the general multiplication rule: P(A and B) = P(A) P(B | A) Statistics and Probability with Applications, 3rdEdition 3 3
The General Multiplication Rule and Tree Diagrams The general multiplication rule says that for both of two events to occur, first one must occur. Then, given that the first event has occurred, the second must occur. To confirm that this result is correct, start with the conditional probability formula The numerator gives the probability we want because P(B and A) is the same as P(A and B). Multiply both sides of the above equation by P(A) to get Statistics and Probability with Applications, 3rd Edition 4 4
Was there divine intervention for Was there divine intervention for Tebow The general multiplication rule The general multiplication rule PROBLEM: Tim Tebow is an American football player who enjoyed tremendous success in the 2011-2012 season. In 2012, Sporting News reported that 70% of U.S. adults had heard of Tim Tebow and that 43% of those who had heard of him believed that divine intervention was at least partly responsible for his success. Suppose that these results are accurate. Find the probability that a randomly selected U.S. adult had heard of Tim Tebow and believed that divine intervention was at least partly responsible for his success. Show your work. P(heard of Tebow and believes divine intervention) = P(heard of Tebow) P(divine intervention | heard of Tebow) = (0.70)(0.43) = 0.301 Tebow? ? Statistics and Probability with Applications, 3rd Edition 5 5
The General Multiplication Rule and Tree Diagrams Shannon hits the snooze button on her alarm on 60% of school days. If she hits snooze, there is a 0.70 probability that she makes it to her first class on time. If she doesn t hit snooze and gets up right away, there is a 0.90 probability that she makes it to class on time. Suppose we select a school day at random and record whether Shannon hits the snooze button and whether she arrives in class on time. We can use a tree diagram to show this chance process. Statistics and Probability with Applications, 3rd Edition 6 6
The General Multiplication Rule and Tree Diagrams Tree Diagram A tree diagram shows the sample space of a chance process involving multiple stages. The probability of each outcome is shown on the corresponding branch of the tree. All probabilities after the first stage are conditional probabilities. What is the probability that Shannon hits the snooze button and is late for class on a randomly selected school day? The general multiplication rule provides the answer: P(hits snooze and late) = P(hits snooze) P(late | hits snooze) = (0.60)(0.30) = 0.18 The previous calculation amounts to multiplying probabilities along the branches of the tree diagram. Statistics and Probability with Applications, 3rd Edition 7 7
The General Multiplication Rule and Tree Diagrams What s the probability that Shannon is late to class on a randomly selected school day? There are two ways this can happen: Shannon can hit the snooze button and be late or she cannot hit snooze and be late. Because these outcomes are mutually exclusive, P(late) = P(hits snooze and late) + P(doesn t hit snooze and late) Statistics and Probability with Applications, 3rd Edition 8 8
Can you judge an e Can you judge an e- -book by its e Tree diagrams Tree diagrams PROBLEM: Recently, Harris Interactive reported that 20% of Millennials (ages 18-36), 25% of Gen Xers (ages 37-48), 21% of Baby Boomers (ages 49-67), and 17% of Matures (ages 68 and older) read more e-books than paper books. According to the U.S. Census Bureau, 34% of those 18 and over are Millennials, 22% are Gen Xers, 30% are Baby boomers, and 14% are Matures. Assume that all of these results are accurate. Suppose that we select one U.S. adult at random. (a) Draw a tree diagram to model this chance process. (b) Find the probability that a randomly chosen person reads more e- books than paper books. book by its e- -cover? cover? Statistics and Probability with Applications, 3rd Edition 9 9
Can you judge an e Can you judge an e- -book by its e Tree diagrams Tree diagrams (a) Draw a tree diagram to model this chance process. book by its e- -cover? cover? Statistics and Probability with Applications, 3rd Edition 10 10
Can you judge an e Can you judge an e- -book by its e Tree diagrams Tree diagrams (b) Find the probability that a randomly chosen person reads more e- books than paper books. P(reads more e-books) =(0.34)(0.20) + (0.22)(0.25) + (0.30)(0.21) + (0.14)(0.17) = 0.0680 + 0.0550 + 0.0630 + 0.0238 = 0.2098 book by its e- -cover? cover? Statistics and Probability with Applications, 3rd Edition 11 11
The General Multiplication Rule and Tree Diagrams Some interesting conditional probability questions involve going in reverse on a tree diagram. For instance, suppose that Shannon is late for class on a randomly chosen school day. What is the probability that she hit the snooze button that morning? We can use the information from the tree diagram and the conditional probability formula to do the required calculation: P(late) = P(hits snooze and late) + P(doesn t hit snooze and late) Statistics and Probability with Applications, 3rd Edition 12 12
Who reads e Who reads e- -books? Tree diagrams and conditional probability Tree diagrams and conditional probability PROBLEM: Recently, Harris Interactive reported that 20% of Millennials (ages 18-36), 25% of Gen Xers (ages 37-48), 21% of Baby Boomers (ages 49-67), and 17% of Matures (ages 68 and older) read more e-books than paper books. According to the U.S. Census Bureau, 34% of those 18 and over are Millennials, 22% are Gen Xers, 30% are Baby boomers, and 14% are Matures. Assume that all of these results are accurate. A randomly selected U.S. adult reads more e-books than hard cover books. What is the probability that this person is a Millennial? ? ????????? ????? ???? ?????? books? =? ????????? ??? ????? ???? ?????? ? ????? ???? ?????? ?.?? ?.?? = ?.?? ?.?? + ?.?? ?.?? + ?.?? ?.?? + (?.??)(?.??) ?.??? ?.???? = ?.???? = Statistics and Probability with Applications, 3rd Edition 13 13
LESSON APP 4.5 Not Milk? Lactose intolerance causes difficulty in digesting dairy products that contain lactose (milk sugar). It is particularly common among people of African and Asian ancestry. In the United States (not including other groups and people who consider themselves to belong to more than one race), 82% of the population is white, 14% is black, and 4% is Asian. Moreover, 15% of whites, 70% of blacks, and 90% of Asians are lactose intolerant. Suppose we select a U.S. person at random. 1. Construct a tree diagram to represent this situation. 2. Find the probability that the person is lactose intolerant. 3. Given that the chosen person is lactose intolerant, what is the probability that he or she is Asian? Statistics and Probability with Applications, 3rd Edition 14 14
LESSON APP 4.5 1. Construct a tree diagram to represent this situation. Not Milk? 2. Find the probability that the person is lactose intolerant. 3. Given that the chosen person is lactose intolerant, what is the probability that he or she is Asian? Statistics and Probability with Applications, 3rd Edition 15 15
The General Multiplication Rule and Tree Diagrams Learning Targets After this lesson, you should be able to: Use the general multiplication rule to calculate probabilities. Use a tree diagram to model a chance process involving a sequence of outcomes. Calculate conditional probabilities using tree diagrams. Statistics and Probability with Applications, 3rd Edition 16 16