Insights on Self-Driving Cars: LIDAR vs. Vision-Based Solutions
Delve into the realm of self-driving cars through a detailed analysis of systems with and without LIDAR technology. Learn about the major players like Tesla, Waymo, and Audi, and their pursuit of autonomy levels 2-5. Explore the cost implications of LIDAR sensors and the shift towards vision-based solutions. Uncover the challenges in the self-driving car pipeline, including the need for high localization accuracy and locally stored maps. Dive deep into the nuances of landmark identification and trigonometry for precise location pinpointing in autonomous vehicles.

Download Presentation

Please find below an Image/Link to download the presentation.
The content on the website is provided AS IS for your information and personal use only. It may not be sold, licensed, or shared on other websites without obtaining consent from the author. Download presentation by click this link. If you encounter any issues during the download, it is possible that the publisher has removed the file from their server.
E N D
Presentation Transcript
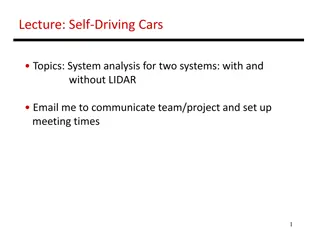
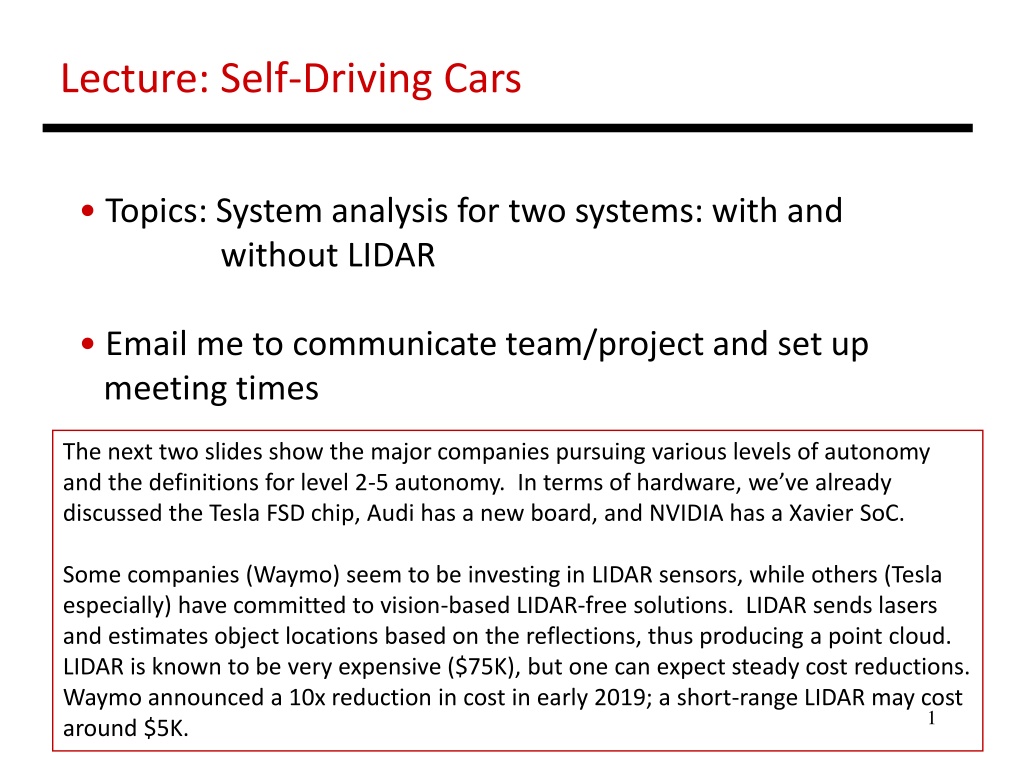
Lecture: Self-Driving Cars Topics: System analysis for two systems: with and without LIDAR Email me to communicate team/project and set up meeting times The next two slides show the major companies pursuing various levels of autonomy and the definitions for level 2-5 autonomy. In terms of hardware, we ve already discussed the Tesla FSD chip, Audi has a new board, and NVIDIA has a Xavier SoC. Some companies (Waymo) seem to be investing in LIDAR sensors, while others (Tesla especially) have committed to vision-based LIDAR-free solutions. LIDAR sends lasers and estimates object locations based on the reflections, thus producing a point cloud. LIDAR is known to be very expensive ($75K), but one can expect steady cost reductions. Waymo announced a 10x reduction in cost in early 2019; a short-range LIDAR may cost around $5K. 1
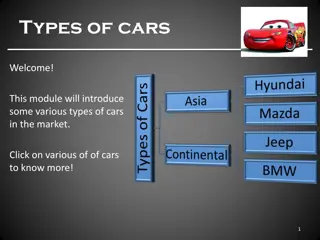
Self-Driving Cars Intro Several players: Waymo, Tesla, Mobileye, Uber, NVIDIA Xavier SoC, Audi zFAS board Level 2 autonomy: car handles steering/accel in limited conditions, (alert) driver handles rest (hands-off) Level 3 autonomy: car handles everything in limited conditions, driver serves as back-up (eyes-off) Level 4 autonomy: driver helps only when entering unmapped areas or during severe weather (mind-off) Level 5 autonomy: no steering wheel 2
LIDAR vs. No-LIDAR LIDAR is very expensive ($75K); hence, Tesla and Mobileye are focusing on vision-based solutions Recent announcements claim that top-of-the-line LIDAR may cost $7,500, with short-range LIDAR being under $5K https://techcrunch.com/2019/03/06/waymo-to-start-selling-standalone-lidar-sensors/ As we ll see, LIDAR has other latency problems 3
Three main bottlenecks in the pipeline. The detector and tracker use well-known DNNs. The localizer is the new and unintuitive step. Self-Driving Car Pipeline Need decimeter-level accuracy for localization; GPS fails; localizer gives them centimeter-level accuracy Need a locally stored map (41 TB for USA) 4
Actually identifying landmarks and using trig equations to pinpoint where you are at cm resolution. Impressive! But needs a local map. Self-Driving Car Pipeline Need decimeter-level accuracy for localization; GPS fails; localizer gives them centimeter-level accuracy Need a locally stored map (41 TB for USA) 5
The paper identifies important metrics. Not surprisingly, predictably low response times and power are the most important. The impact of these computers on driving range is clearly non-trivial. Metrics 99.99th percentile tail latency of 100ms would be faster than fastest human reaction times (target supported by industry, but will likely be a moving target); 10 frames/sec Power and cooling (need cooling because the computers will be inside the cabin); 77W cooling for every 100W dissipated; a 400W computer reduces MPG by 1; a CPU+3GPU system (~1000W) lowers driving range by 6% (and 11.5% once you add storage+cooling) Also need high storage and reliability (recall that Tesla FSD executes every computation twice) 6
Of these algorithms, the localization one is new. But they arent very clear about what the feature extraction algorithm does (the blog post linked at the end has more details). The trig calculations are simplified with look-up tables. Algorithms Object detection: YOLO; DNN based Object tracker: GOTURN; DNN based and a few book-keeping tables Localization: ORB-Slam; lots of trigonometric calculations Motion and Mission planning: MOTPLAN and MISPLAN from Autoware 7
The CPU solution is clearly sub-optimal. This also shows that most of the time is in those three phases, with much of it spent in DNNs. Bottleneck Analysis DNNs implemented with Eyeriss and EIE 8
Feature Extraction Ops in feature detector not clear (a blog post that may be helpful is listed on the last slide) Rest are trig ops that are implemented with LUTs 10
They do much better with ASICs. The GPU does great too, but consumes too much power. The FPGA is fine if an ASIC is not possible. The overall latency is close to the 100ms target. Results Power for a single camera (Tesla has 8) For the whole system, GPU lowers driving range by 12% and ASICs by 2% 11
The accuracy improvement with higher resolution is compelling. But they show that latency is too high. Can probably do it with multiple ASICs. The system will also scale up along other axes: more cameras, higher resolution, more redundancy, larger networks. Scalability Results VGG accuracy improves from 80% to 87% when resolution is doubled Not clear how the bottlenecks change (compute, memory, reuse patterns) 12
Summary Detection, Localization, Tracking, Planning are major steps The first three take up 94% of compute Contributions: a pipeline with publicly available frameworks, bottleneck analysis, acceleration with GPU/FPGA/ASIC GPUs and ASIC offer two orders of magnitude speedup, but GPUs consume too much power More work remains lower latency, lower power, higher resolution, feature extraction, other bottlenecks 13
LIDAR-based Approach [Zhao et al.] Joint work with Pony.AI; characterization based on several hours of driving on their test fleet over 3 months They rely on LIDAR and their software pipeline has relatively little DNN The second paper considers a LIDAR-based pipeline. It does have a limited amount of DNN computation. But as shown in the next slide, 65% of the computation is LIDAR based perception. This last computation is itself spread across several functions, of which Segmentation is the largest (the computations that identify/separate major objects from the background). This makes it harder to create an accelerator that improves all the functions. It turns out that LIDAR perception has varying latency based on the nature of the point cloud. Scenes with more nearby objects take longer to analyze; this is especially problematic since those are the scenes that need speedy resolution. 14
LIDAR Pipeline Several steps, with segmentation being a major overhead Segmentation extracts useful semantic info (relevant objects) from the background The latency is worse when there are more nearby objects, since there are more reflected points to deal with This leads to high variance, especially when collisions are more likely 16
The authors show that if LIDAR perception latency exceeds the LIDAR sampling rate (100ms), the impact on other stages of the software pipeline is even higher. LIDAR Perception Latency Max time is a relevant metric because it disproportionately impacts safety They observe that long LIDAR perception latency also disproportionately impacts overall latency (The LIDAR sampling rate is 100ms) 17
To improve performance, they first predict if the point cloud will take longer to analyze, if yes, then they re-allocate CPU/GPU resources across the many software functions. The impact is evaluated with a safety score that shows how the response latency ultimately impacts safety. The equation factors the sampling rate, vehicle acceleration and velocity. Safety Score They compute a safety score that factors in the response time along with velocity/acceleration They design a predictor to estimate response time based on the count/proximity of objects in the scene and how hardware resources (CPU/GPU) are allocated to each part of the software pipeline 18
References The Architectural Implications of Autonomous Driving: Constraints and Acceleration , S.-C. Lin et al., ASPLOS 2018 Towards Safety Aware Computing System Design in Autonomous Vehicles , Zhao et al., Arxiv, 2019 Driving into the Memory Wall , Jung et al., MemSys 2018 ORB-Slam details: https://medium.com/software-incubator/introduction-to-orb-oriented-fast-and-rotated-brief-4220e8ec40cf 19