Novel Classification of Cirrus Cloud Ice Crystal Habits Using Combined Lidar-Polarimeter Observations
Lidar and polarimeter observations from the SEAC4RS campaign were combined to cluster ice crystals into 7 distinct habits, providing insights into cirrus cloud properties. This study showcases the potential for future space-based missions to retrieve ice crystal properties accurately to improve cloud radiative forcing estimates and advance Earth observation capabilities.

Download Presentation

Please find below an Image/Link to download the presentation.
The content on the website is provided AS IS for your information and personal use only. It may not be sold, licensed, or shared on other websites without obtaining consent from the author. Download presentation by click this link. If you encounter any issues during the download, it is possible that the publisher has removed the file from their server.
E N D
Presentation Transcript
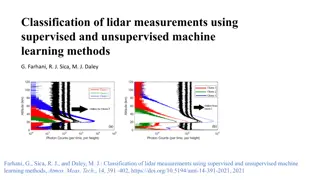
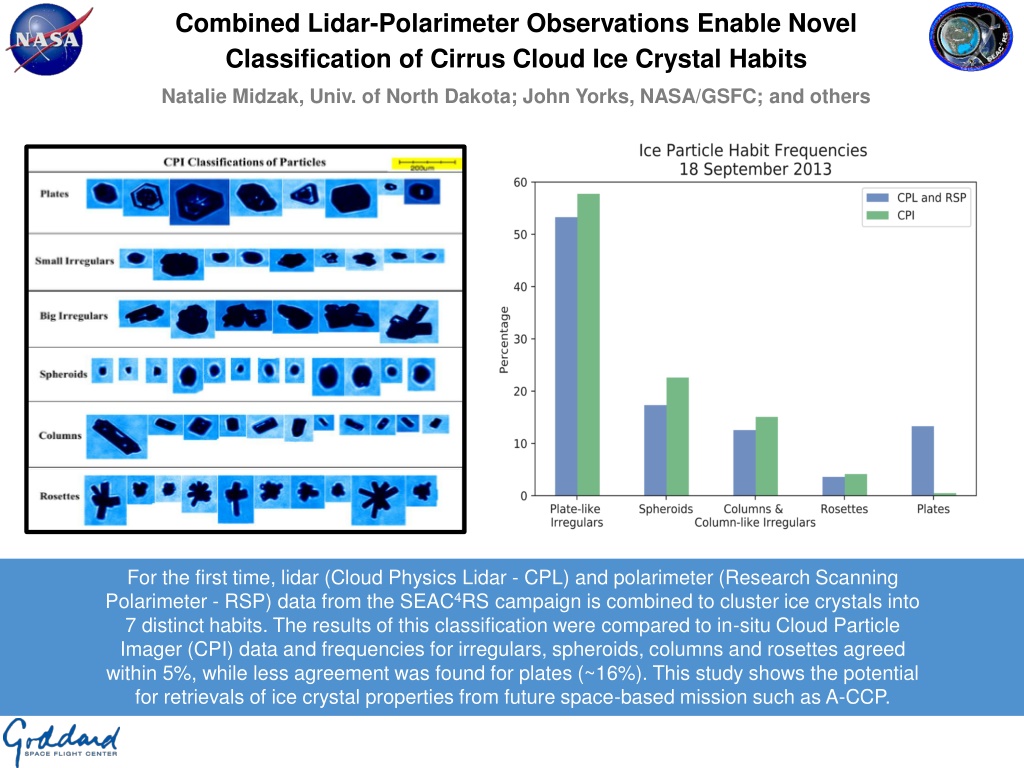
Combined Lidar-Polarimeter Observations Enable Novel Classification of Cirrus Cloud Ice Crystal Habits Natalie Midzak, Univ. of North Dakota; John Yorks, NASA/GSFC; and others For the first time, lidar (Cloud Physics Lidar - CPL) and polarimeter (Research Scanning Polarimeter - RSP) data from the SEAC4RS campaign is combined to cluster ice crystals into 7 distinct habits. The results of this classification were compared to in-situ Cloud Particle Imager (CPI) data and frequencies for irregulars, spheroids, columns and rosettes agreed within 5%, while less agreement was found for plates (~16%). This study shows the potential for retrievals of ice crystal properties from future space-based mission such as A-CCP.
Name: E-mail: John.E.Yorks@nasa.gov Phone: 301-614-6284 John Yorks, NASA/GSFC, Code 612 References: Midzak, N., J. E. Yorks, J. Zhang, B. van Diedenhoven, S. Woods, and McGill, M, 2020: A classification cirrus ice crystal habits using combined CPL and RSP data during the SEAC4RS campaign, J. Atmos. Oceanic Technol (in review) Data Sources: Data collected during the Studies of Emissions and Atmospheric Composition, Clouds and Climate Coupling by Regional Surveys (SEAC4RS) campaign from the Cloud Physics Lidar (CPL) can be found at cpl.gsfc.nasa.gov. Ice cloud retrievals from the Research Scanning Polarimeter (RSP) obtained during SEAC4RS can be found at www-air.larc.nasa.gov/missions/seac4rs/. Technical Description of Figures: Cloud Particle Imager (CPI) Data (left) collected during 18 September 2013 Learjet flight from the SEAC4RS field campaign highlight the variations in crystal shape and size within cirrus clouds, with habit types such as plates, irregulars, spheroids, columns, and rosettes. Frequencies of ice crystal habits (right)classified by CPI (green) and the newly developed CPL-RSP technique (blue) for a case study on 18 September 2013 from the SEAC4RS campaign. This flight was the only flight in which the CPI on the Learjet flew near-coincidently with the CPL and RSP instruments on the NASA ER-2. The 3 instruments measured roughly the same clouds at the same altitudes within about 15 minutes. Agreement for irregulars, spheroids, columns and rosettes is within 5% with less agreement for plates (~16%) due to differences in definitions of plates between methods. Additionally, sampling differences contribute to the disagreement, with CPI sampling individual ice crystals at a mean altitude of 7 km while the CPL-RSP retrievals are of bulk cloud top properties at a mean altitude of 11.4 km. Scientific significance, societal relevance, and relationships to future missions: Cirrus consistently cover almost half the earth and can either warm or cool the atmosphere depending on their microphysical and optical properties. Due to uncertainties in cirrus microphysical properties, radiative forcing calculations generally assume more simplified crystal habits than those shown in this study. These assumptions lead to inaccuracies of cloud radiative forcing estimates. Retrievals from combined backscatter lidar and a multi-channel/multi-angle polarimeter flown on board the same platform, as demonstrated here, serves as a direct response to priorities set forth by NASA s Decadal Strategy for Earth Observation from Space (2018). This study suggests that a detailed ice crystal habit retrieval could be applied to combined space- based lidar and polarimeter observations, like those obtained in the upcoming Aerosols, Clouds, Convections and Precipitation (A- CCP) spaceborne mission to study cloud and aerosol properties. Earth Sciences Division - Atmospheres
Cloud Detection over Snow and Ice using DSCOVR-EPIC s Oxygen Bands Yaping Zhou1,2, Yuekui Yang1, Meng Gao3, Peng-Wang Zhai4 1NASA/GSFC, Code 613, 2UMBC-JCET, 3SSAI, 4UMBC ?0+ ?1? + ?2ln? ?abs ?ref ???? Satellite cloud detection over snow and ice with passive remote sensing instruments is challenging due to the lack of contrast between clouds and cold/bright surfaces. Detections usually rely on shortwave infrared (IR) channels. With no such channels available, the Earth Polychromatic Imaging Camera (EPIC) instrument onboard the Deep Space Climate Observatory (DSCOVR) relies on two oxygen band ratios to detect clouds over snow and ice. We developed a novel dynamic threshold scheme for the oxygen band ratios and achieved significant improvements over the existing algorithm.
Name: Yaping Zhou, NASA/GSFC, Code 613, and UMBC-JCET E-mail: Yaping.Zhou-1@nasa.gov Phone: 301-614-6235 Reference: Zhou, Y., Y. Yang, M. Gao, and P.-W. Zhai. 2020. "Cloud detection over snow and ice with oxygen A- and B-band observations from the Earth Polychromatic Imaging Camera (EPIC)." Atmospheric Measurement Techniques. 13 (3): 1575-1591 [10.5194/amt-13-1575-2020] Data Sources: NASA DSCOVR EPIC Data Level 1B radiances (https://eosweb.larc.nasa.gov/project/dscovr/dscovr_epic_l1b_2), Level 2 cloud products Version 1 (https://eosweb.larc.nasa.gov/project/dscovr/dscovr_epic_l2_cloud_01 ), and GEO/LEO composites (https://eosweb.larc.nasa.gov/project/dscovr/dscovr_composite_l2_01 ) are available at the Atmospheric Science Data Center (ASDC) at NASA Langley Research Center. Technical Description of Figures: The Oxygen A-band (764 nm, 780 nm) and B-band (688 nm, 680 nm) ratios are used for cloud detection over snow and ice because reflected light by clouds encounters less O2 absorption in its path for the absorption band while the shorter photon path does not impact the reference (non-absorbing) channel. Thus, the oxygen band ratios are normally higher for cloud pixels than clear pixels under otherwise identical conditions. In cases of high zenith angle and high elevation, the clear sky ratios will decrease or increase due to longer or shorter total photon length. The new cloud mask algorithm uses a dynamic threshold that takes into consideration the impact of elevation and zenith angles for better defining the clear sky oxygen band ratios. The image shows cloud fractions derived from (a) composite GEO/LEO retrievals, (b) original EPIC cloud mask, (c) new EPIC cloud mask over Antarctica in January 2017. Note that the GEO/LEO composites are produced by NASA Langley, and comprises GEO satellites from GOES, MET, Himawari, and LEO satellites from Terra, Aqua, VIIRS, etc. Since the GEO satellites do not cover beyond 60o, the GEO/LEO measurements in the Antarctic are in reality only from LEO. The new cloud fraction corrects the reversed cloud distribution in Antarctica between the Version 1 cloud mask and the composite GEO/LEO cloud fraction. Scientific significance, societal relevance, and relationships to future missions: Satellite cloud detection over snow and ice has been difficult for passive remote sensing instruments due to the lack of contrasts between clouds and cold/bright surfaces. The oxygen band technique developed in this study is relatively insensitive to the surface and atmosphere temperature and provides a solution to polar cloud detection when infrared channels are not available, or struggle to distinguish between cloudy and clear scenes. Cloud detection with oxygen band could be a great addition in future missions for monitoring cloud change over snow and ice covered polar and high mountain regions. Earth Sciences Division - Atmospheres
Abrupt decline in tropospheric nitrogen dioxide over China after the outbreak of COVID-19 Fei Liu (USRA/GSFC), Sarah A. Strode (USRA/GSFC), Yasuko Yoshida (SSAI/GSFC), Sungyeon Choi (SSAI/GSFC), Lok N. Lamsal (USRA/GSFC), Can Li (ESSIC/GSFC), Nickolay A. Krotkov (GSFC), Joanna Joiner (GSFC) and others Tropospheric nitrogen dioxide (NO2) indicates economic activities, as NO2 is primarily emitted from fossil fuel consumption. We evaluated the reduction in satellite measurements of NO2 tropospheric vertical column densities (TVCD) before and after the Lunar New Year (LNY). The observed reduction in 2020 is ~20% larger than the typical holiday-related reduction. Top: Average OMI tropospheric NO2 vertical column densities over China in 2020. (A) -20 to -1, (B) 0-19, and (C) 20-39 days relative to the 2020 Lunar New Year. Bottom: Daily variations in 7-day moving averages of OMI NO2 TVCDs over China. Shading shows standard error of the mean. Values are normalized to the mean of the period of -20 to -1 days relative to Lunar New Year. We relate to this reduction to two of the government s actions: the announcement of the first report in each province and the date of a province s lockdown. Both actions are associated with nearly the same magnitude of reductions.
Name: Fei Liu, NASA/GSFC, Code 614 E-mail: fliu@usra.edu Phone: 301-538-1536 References: F. Liu, A. Page, S. A. Strode, Y. Yoshida, S. Choi, B. Zheng, L. N. Lamsal, C. Li, N. A. Krotkov, H. Eskes, R. van der A, P. Veefkind, P. F. Levelt, O. P. Hauser, J. Joiner, Abrupt decline in tropospheric nitrogen dioxide over China after the outbreak of COVID-19. Science Advances, eabc2992 (2020). https://advances.sciencemag.org/content/early/2020/06/12/sciadv.abc2992 Data Sources: Satellite-derived emission estimates are based on NO2 measurements from the Aura Ozone Monitoring Instrument (OMI) and the Tropospheric Monitoring Instrument (TROPOMI). OMI is a Dutch Finnish contribution to the NASA Aura mission. TROPOMI is on board the European Copernicus Sentinel-5 Precursor satellite. Technical Description of Figure: Consistent with the 2015 2019 data, the 2020 NO2 TVCD 7-day moving averages show a significant reduction during approximately the two weeks leading up to LNY and reach a minimum around LNY, consistent with the gradual shutdown of factories before the holiday. In prior years, a rebound of NO2 TVCD usually begins around 7 days after LNY, marking the end of the holiday season. However, while the 2020 data show similar initial declines in the week leading up to LNY, we do not observe the typical uptick in NO2 TVCDs starting the week after the LNY as in previous years. OMI (and TROPOMI) NO2 TVCDs show a longer period of low values near the minimum. Scientific significance and societal relevance: We use two instruments (OMI and TROPOMI) to investigate the reductions in NO2 TVCDs over China after the outbreak of COVID-19. We use Goddard Earth Observing System coupled to the NASA Global Modeling Initiative (GEOS-GMI) model simulations with constant emissions to rule out the possibility that the large NO2 TVCD decreases observed in 2020 are driven by changes in the meteorological conditions. We next explore how COVID-19 policy interventions are associated with reductions in NO2 TVCD. Our results suggest that the announcement of the first case was followed by a reduction in NO2, with a further reduction following the actual lockdown. Examining this unusual period has provided a scenario of a society that has substantially lowered fossil fuel usage including mobility associated with these fuels. Earth Sciences Division - Atmospheres