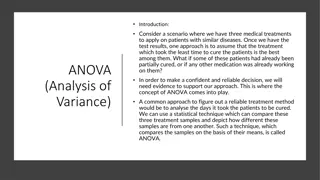
Two-Way ANOVA Analysis of Sleep Deprivation and Stimulant Effects on Driving Performance
This study presents a two-way ANOVA analysis involving sleep deprivation conditions and stimulant effects on driving performance in a simulated truck driving task. The research explores the impact of different sleep deprivation scenarios and stimulant types on individuals' scores in a video game that simulates driving at night, revealing insights into the intricate relationship between sleep quality, stimulant intake, and cognitive performance.

Download Presentation

Please find below an Image/Link to download the presentation.
The content on the website is provided AS IS for your information and personal use only. It may not be sold, licensed, or shared on other websites without obtaining consent from the author. Download presentation by click this link. If you encounter any issues during the download, it is possible that the publisher has removed the file from their server.
E N D
Presentation Transcript
TWO-WAY ANOVA COHEN CHAPTER 14 TEXTBOOK EXAMPLE
3 X 4 TWO-WAY ANOVA, COMPLEX MOTOR TASKS DV (dependent variable) score on a video game that simulates driving a large truck at night IV (categorical independent variables) Sleep deprivation (subjects spend four days in a sleep lab) (1) Control: allowed to follow their own sleep schedule (2) Jet Lag: keep usual amount, but not allow any during 11pm-7am (3) Interrupted: usual amount, but no more that 2 hours at a time, separated by 1+ hours awake (4) Total Deprivation: total lack of any sleep Stimulant (1) placebo: sugar pill, but told it is caffeine (2) caffeine: caffeine pill, told it is caffeine (3) reward: mild electric shocks for mistakes & money for good performance Subjects 5 per sleep x stimulant combination 5 x (4 x 3) = 5 x 12 = 60
DATA Placebo 24 20 29 20 28 22 18 16 25 27 Caffeine 26 22 20 30 27 25 31 24 27 21 Reward 28 23 24 30 33 26 20 32 23 30 Control Jet Lag 16 20 11 19 14 14 17 12 18 10 23 28 26 17 19 23 16 26 18 24 16 13 12 18 19 15 11 19 11 17 Interrupted Total Lack
MARGINAL MEANS Placebo 24 20 29 20 28 22 18 16 25 27 16 20 11 19 14 14 17 12 18 Placebo 24 20 29 20 28 22 18 16 25 27 16 20 11 19 14 14 17 12 18 10 10 Placebo Caffeine 26 22 20 30 27 25 31 24 27 21 23 28 26 17 19 23 16 26 18 24 24 Caffeine 26 22 20 30 27 25 31 24 27 21 23 28 26 17 19 23 16 26 18 Caffeine Reward 28 23 24 30 33 26 20 32 23 30 16 13 12 18 19 15 11 19 11 17 17 Reward 28 23 24 30 33 26 20 32 23 30 16 13 12 18 19 15 11 19 11 Reward Control Control Control M = 25.6 N = 15 25.6 24.2 25.0 27.6 Jet Lag Jet Lag Jet Lag M = 24.47 N = 15 24.47 21.6 25.6 26.2 Interrupted Interrupted Interrupted M = 18.07 N = 15 18.07 16.0 22.6 15.6 Total Lack Total Lack Total Lack M = 16.73 N = 15 16.73 14.2 21.4 14.6 M = 19.0 N = 20 19.0 M = 23.65 N = 20 23.65 M = 21.0 N = 20 21.0 21.217 M = 21.217 N = 60
PLOT OF MEANS Placebo Caffeine Reward Norm 24.2 25.0 27.6 25.6 Main Effect of Sleep Lag 21.6 25.6 26.2 24.47 Int 16.0 22.6 15.6 18.07 Interaction between Sleep & Stimulant None 14.2 21.4 14.6 16.73 Main Effect of Stimulant 19.0 23.65 21.0 21.217
DEGREES OF FREEDOM c = number of columns Total r = number of rows 60 1 = 59 n = subjects per cell Denominator of F ratios Total = rnc 1 Within Cells 60 - 12 = 48 Between Cells 12 1 = 11 Between cells = rc - 1 Columns 3 1 = 2 Rows Rows = r - 1 4 1 = 3 Columns = c - 1 Interaction 3 x 2 = 6 Numerators of F ratios Interaction = (r 1)(c 1) Within cells = rnc - rc
2-WAY ANOVA IF THE INTERACTION IS SIGNIFICANT SS Df 11 MS F p Between-Cells SLEEP Row Groups STIM Column Groups INTER (Row x Col) Within-Cells (Residual) Total 1309.38 896.98 3 298.99 18.241 <.001 217.63 2 108.82 6.639 .003 MAIN EFFECTS SHOULD NOT BE INTERPRETED IN ISOLATION 197.77 786.80 2096.18 6 48 59 32.46 16.39 1.980 .087
INTERACTION CONTRASTS Does CAFFEINE have the same effect in NO SLEEP as NORMAL SLEEP? If the interaction is significant pick TWO PAIRS to compare (extreme) ? = 2?2: ?????= ? 1 ? 1 = 1 Caffeine s Effect in None Caffeine s Effect in Normal ??= 1, -1, -1, 1 ?11 ?12 ?21 ?22 ? = 2= 4 ?? ?11 ?12 ?21 + ?22 Placebo Caffeine Reward Placebo Caffeine Reward Placebo Caffeine ? = ? ?11 + ? ?12 ? ?21 + ? ?22 + Norm Norm Norm 24.2 24.2 24.2 25.0 25.0 25.0 27.6 27.6 25.6 25.6 ? = ? ? = 24.2 25.0 14.2 + 21.4 = ?.? ? ?2 ?? + ? + ? +? Lag Lag ????? ??? 21.6 21.6 25.6 25.6 26.2 26.2 24.47 24.47 25.0 24.2 ?????= ????= 2 Int Int 16.0 16.0 22.6 22.6 15.6 15.6 18.07 18.07 14.2 21.4 5 6.42 1 + 1 + 1 + 1=5 40.96 =204.8 ?????= = ??.? None None None 4 4 14.2 14.2 14.2 21.4 21.4 21.4 14.6 14.6 16.73 16.73 51.2 ??.??= ?.?? ????= ??? ????= ????? ? ?????,??? 19.0 19.0 23.65 23.65 21.0 21.0 21.217 21.217 ????????= ? ? ?,?? = 6 ?.056,40 = 6 2.34 = ??.??
INTERACTION CONTRASTS Does CAFFEINE have the same effect in NO SLEEP as NORMAL SLEEP? Placebo Caffeine Reward ?????????= ?.?? Norm Are the lines PARALLEL? 24.2 25.0 27.6 25.6 Vs ????????= ??.?? 0.8 Lag 21.6 25.6 26.2 24.47 Int 16.0 22.6 15.6 18.07 7.2 None Just compare the 2 pairs of points (ignore the rest) 14.2 21.4 14.6 16.73 19.0 23.65 21.0 21.217 This provides no evidence that CAFFEINE has a different effect in NORMAL SLEEP vs TOTAL DEPRIVATION.