Introduction to Stars: Properties, Brightness, and Magnitudes
Stars are fundamental celestial objects that burn matter through nuclear fusion, revealing critical physical properties such as temperature, luminosity, and composition. This lecture explores the magnitude system, color-magnitude diagrams, and the concept of brightness in stars. Understanding stars is key to deciphering the vast universe they dominate.

Download Presentation

Please find below an Image/Link to download the presentation.
The content on the website is provided AS IS for your information and personal use only. It may not be sold, licensed, or shared on other websites without obtaining consent from the author. Download presentation by click this link. If you encounter any issues during the download, it is possible that the publisher has removed the file from their server.
E N D
Presentation Transcript
UNIVERSITY ASTRONOMY Professor Don Figer Properties of Stars I 1
Aims and outline for this lecture introduce magnitude system review properties of stars color brightness luminosity temperature color-magnitude diagram HR diagram discuss filter systems 2
Stars in the Universe Stars are defined as objects that burn matter through nuclear fusion as a result of intense pressure and temperature induced by the force of self-gravity. Stars constitute a tiny fraction of the mass in the Universe, only 0.5%. They dominate the visible Universe. Their light can tell us physical properties, i.e. temperature, luminosity, pressure, and composition. Stellar lifetimes are completely determined by their nuclear fuel. 5
MAGNITUDES AND LUMINOSITY
What is Brightness? When we say that an object is bright, we are using a shorthand way of saying that our eyes detect a relatively high number of photons. The photon rate we detect is dependent on the number of photons that pass through the pupils of our eyes. If our pupils were bigger, we would see even more photons. So, brightness is a measure of photons per area (#/m2), also known as the photon flux. Equivalently, one can express brightness as energy received per unit area (Watts/m2). 8
Brightness and Units The difference in photon flux for a bright object versus a faint object is huge! If you looked at the Sun (but don t!), your retina would receive about 1015 photons/second. Compare that to a bright star. For Vega, your retina would receive about 104 photons/second. A faint star would generate about 50 photons/second. These numbers are all very different. Also, these numbers are very awkward to use. The situation isn t any better if we used Watts/m2. 9
Use a Log Scale! By using the log of the flux, we can have more easily manageable ways to compare the brightness of astronomical objects. Norman Pogson created the magnitude scale in 1856. He used Hipparcus brightness rankings to define the magnitude scale such that a star that is of 5th magnitude would be 100 times fainter than a star of 0th magnitude. This scale assigns smaller magnitudes for brighter objects. Astronomers still use this type of scale to refer to the brightnesses of objects. The magnitude scale is usually set by giving Vega a magnitude of zero. 10
Magnitudes stellar magnitudes F F 2.5 log = m 10 0 F, F0 are the photon numbers received per second from object and zero magnitude reference star, respectively. So, a star that is 100 times fainter than another is said to be 5 magnitudes fainter. For the most common magnitude systems, the reference star is Vega, which is defined to have zero magnitude in all filters. 11
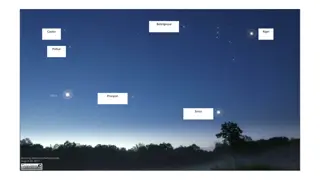
Question Which star on the following slide is the brightest? Which is the most luminous? Which is the most massive? 13
Absolute Magnitude Absolute Magnitude M is the magnitude measured at a Standard Distance (10 pc 33 light years) Allows luminosities to be directly compared Absolute magnitude of sun +5 (pretty faint) F = 10 F d pc = 5 . 2 + log . M m 10 L = . F ( ) 2 4 distance 15
Absolute Magnitude and Distance L 2 4 1 ( 0 L pc) = 5 . 2 + log M m 10 2 4 ( distance) 2 distance distance = 5 . 2 + = + log 5 log m m 10 10 10 pc 10 pc d = m + + 5 log = d{pc} 5 . m 10 ( pc ) = 5 log 5 distance modulus . M 10 16
Bolometric Correction Absolute magnitude is usually determined for a specific waveband, e.g. MV is the absolute magnitude of a star in the V band. One can convert from this absolute magnitude to a bolometric absolute magnitude that accounts for flux in all wavebands. Of course, this correction must depend on the waveband of the measurement and the temperature of the star. ???????????= ?????????+ ?????????? ???????????= ??+ ??? ???????????,???= ??,???+ ???,??? ???????????,???= 4.83 0.09 = 4.74 17
Question Let s say that a star has an apparent magnitude of 5 and is 100 pc away. What is its absolute magnitude? 18
Answer ? ? = 5log ? 5 ? = ? + 5 5log ? ? = 5 + 5 5log 100 = 0 19
Stellar Brightness Differences If we can determine that 2 stars are identical, then their relative brightnesses translate to relative distances. Example: Sun vs. Cen spectra are very similar temperatures, radii almost identical (T follows from Planck function, radius R can be deduced by other means) luminosities about equal difference in apparent magnitudes translates to relative distances can check using the parallax distance to Cen 20
TEMPERATURES AND COLOR
Why do Stars Have Colors? Stars have different temperatures. Given that they radiate like blackbodies, their photon fluxes peak at different wavelengths (think of the Wein displacement law). Our eyes perceive a color that relates to the peak wavelength of emission. A relatively cool star will appear to be red. A hot star will appear more blue. You can determine the relative temperature of a star just by looking at its color! 22
Brightness, Color, and Temperature http://zebu.uoregon.edu/~soper/Stars/hrdiagram.html 23
Betelguese and Rigel in Orion Betelgeuse: 3,500 K (a red supergiant) Rigel: 11,000 K (a blue supergiant) 24
Blackbody curves for hot and cool stars 25
Two stars Hotter stars emit MUCH more light per unit area much brighter at short wavelengths. 26
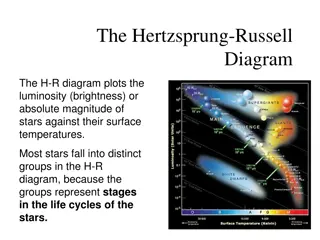
HR Diagram: History 1911: E. Hertzsprung (Denmark) compared star luminosity to color for stars in several clusters. These stars were likely formed at the same time. 1913: Henry Norris Russell (U.S.) did same for stars in solar neighborhood. These stars were likely formed at different times. 30
HR Diagram of Nearby Stars Plot of 22,000 stars in Hipparcos Catalogue and Gliese Catalogue of nearby stars Stars are not coeval range of ages Main sequence is easily seen hydrogen burning stars Red giant clump is prominent 90% of stars on Main Sequence 10% are White Dwarfs <1% are Giants 32
HR Diagram and Cluster Age Star clusters have stars that all formed at roughly the same time out of a collapsing cloud. An HR Diagram of a star cluster reveals the age of that cluster. Massive stars in a cluster die earlier than low mass stars. Massive stars are bright and hotter than less massive stars. A cluster that has brighter and hotter stars than another cluster is younger. Consider the two clusters on the next slide. The cluster with brighter stars (M67) is younger. 33
Filters One of the most common tasks for an astronomer is to measure the brightness of an object as a function of wavelength. This is done by exposing a detector to light from the object within a waveband. Light from the object is transmitted by a filter that only allows photons of a range of wavelengths. The filters are standardized so that astronomers can compare their measurements. 36
Optical Astronomical Filter Set There are many filter sets Johnson Kron-Cousins SDSS HST etc. 5 Bessel Filters with approximately equal passbands : 100 nm U: ultraviolet , max 350 nm B: blue , max 450 nm V: visible (= green ), max 550 nm R: red , max 650 nm I: infrared, max 750 nm 37
Photometry Photometry is the measurement of light. The term is short for photon metering. An astronomer makes this measurement using an instrument on a telescope. There are many software packages that an astronomer can use to calculate the amount of light in an image for an individual astronomical object. The reported results can be in a variety of units. One example is photons per second per square meter. Another is Watts per square meter. Sometimes, we translate that into Janskys. 40
Photometric Units Allen s Astrophysical Quantities, p. 150. Fluxes are for a star with zero magnitude. F ( m) ( m) (Wm-2 m-1) 0.5556 0.089 3.44 x 10⁻⁸ J 1.215 0.26 3.31 x 10⁻⁹ H 1.654 0.29 1.15 x 10⁻⁹ Ks 2.157 0.32 4.30 x 10⁻¹⁰ K 2.179 0.41 4.14 x 10⁻¹⁰ L 3.547 0.57 6.59 x 10⁻¹¹ L1 3.761 0.65 5.26 x 10⁻¹¹ M 4.769 0.45 2.11 x 10⁻¹¹ 8.7 8.756 1.2 1.96 x 10⁻¹² N 10.472 5.19 9.63 x 10⁻¹³ 11.7 11.653 1.2 6.31 x 10⁻¹³ Q 20.13 7.8 7.18 x 10⁻¹⁴ Filter Fv (Jy) N (g g s 1 m 2 m 1) 3540 V 9.60 x 10¹⁰ 2.02 x 10¹⁰ 9.56 x 10⁹ 4.66 x 10⁹ 4.53 x 10⁹ 1.17 x 10⁹ 9.94 x 10⁸ 5.06 x 10⁷ 8.62 x 10⁷ 5.07 x 10⁷ 3.69 x 10⁷ 7.26 x 10⁶ 1630 1050 667 655 276 248 160 50 35.2 28.6 9.7 41