Integrated Sediment Model for Nutrient Processes in Chesapeake Bay
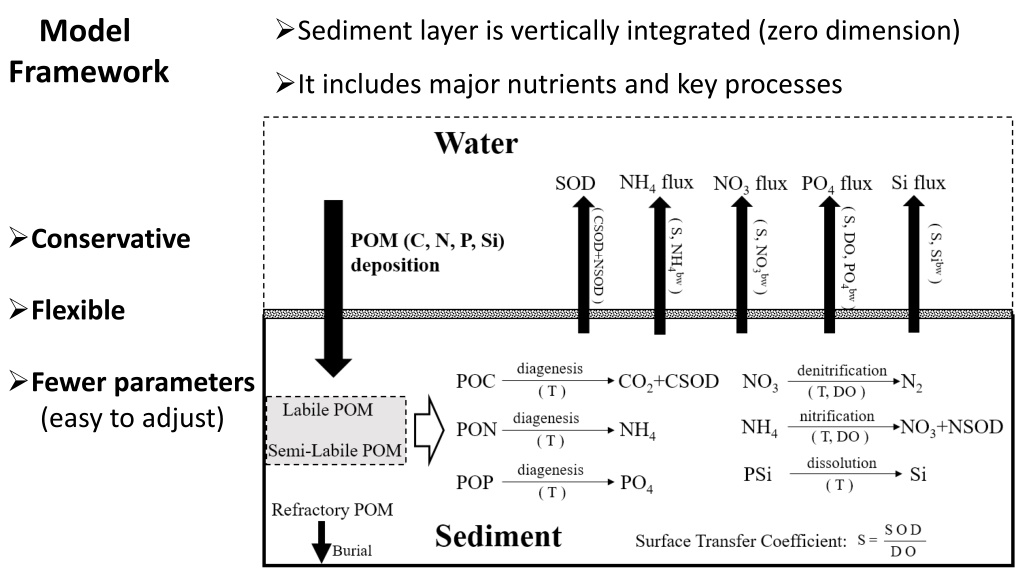
This sediment model framework integrates major nutrients and key processes in a vertically integrated, zero-dimensional scheme. It is characterized by its conservative and flexible nature, with fewer parameters making adjustments easy. The model includes a scheme for POM remineralization and finds application in sediment measurements in the Chesapeake Bay since 1985. Calibration of sediment fluxes and simulations from 1985 to 1996 demonstrate the model's accuracy in capturing seasonal variations and flux magnitudes in the bay.
Download Presentation

Please find below an Image/Link to download the presentation.
The content on the website is provided AS IS for your information and personal use only. It may not be sold, licensed, or shared on other websites without obtaining consent from the author. Download presentation by click this link. If you encounter any issues during the download, it is possible that the publisher has removed the file from their server.
E N D
Presentation Transcript
Sediment layer is vertically integrated (zero dimension) Model Framework It includes major nutrients and key processes Conservative Flexible Fewer parameters (easy to adjust)
Scheme for POM remineralization Note: = 1mmol m , | = 2 | POM = = 0 0 max t t The decay rate depends on the history of POM deposition and bacteria growth: dPOM dt = FPOM POM dN dt FPOM POM = k N = max , N k N where: =POM concentration in sediment (mmol m-2) =POM settling fluxes from water column (mmol m-2 day-1) = bacteria density in unit POM mass =the overall decay rate of POM (day-1) =the growth rate of bacteria (day-1) =maximum decay rate of POM (day-1) =the ratio between the growth rate of bacteria and maximum decay rate of POM POM FPOM N , k max max The mineralization scheme is conservative The scheme is also flexible in represent the short-term and long-term POM mineralization processes
Application in Chesapeake Bay Sediment https://gonzo.cbl.umces.edu/sediments.htm. These measurements are conducted by Boynton since 1985 (Boynton and Bailey 2008). They have a good spatial coverage in Upper and Mid Bay. Many parameters are measured: SOD NH4 Flux NO3 Flux PO4 Flux Silica Flux Surficial POC, PON, POP concentrations etc. Flux Measurements are downloaded from Chesapeake Bay Program (CBP) Water Quality Data are downloaded from https://www.chesapeakebay.net/what/data. Data are from 1984 and have a good spatial coverage in entire Chesapeake Bay. The datasets contains all kinds of parameters. They includes: Temperature Salinity DO NH4, NO3, PO4, Si concentrations. POC, PON, POP concentrations etc.
Model Calibration for sediment fluxes at R-64 and SLPD Sediment Flux model is calibrated against observations for 4 variables: SOD, NH4, NO3 and PO4 The shaded area represents the condition when the corresponding depositional POM flux changes 50% The model well captured the seasonal variation of sediment fluxes The same calibration parameters shown in the table will be used for other application in this study
Simulation from 1985 to 1996 : SOD For each station, a constant sinking velocity for POM calculated above is used. Overall, the comparison is good for all four stations. The magnitude is right. The model captures some low and high SOD fluxes.
Nitrogen Cycling at Station R-64 Nitrogen Concentrations Nitrogen Fluxes Nitrogen Budget
