Gaussian Statistics and Confidence Intervals in Population Sampling
Explore Gaussian statistics in population sampling scenarios, understanding Z-based limit testing and confidence intervals. Learn about statistical tests such as F-tests and t-tests through practical examples like fish weight and cholesterol level measurements. Master the calculation of confidence intervals for different levels of certainty using the Normal Distribution model.

Download Presentation

Please find below an Image/Link to download the presentation.
The content on the website is provided AS IS for your information and personal use only. It may not be sold, licensed, or shared on other websites without obtaining consent from the author. Download presentation by click this link. If you encounter any issues during the download, it is possible that the publisher has removed the file from their server.
E N D
Presentation Transcript
Announcements I [Introduce Self] Pipet Calibration Lab Reports now due 9/20 Quiz 2 On 9/20 (those of you with points under Quiz 2 in SacCT should have been in Lab Procedures Quiz column) Today s Lecture Gaussian Statistics (Chapter 4) Z-based limit testing Confidence Intervals (Z-based and t-based) Statistical Tests (F-test, t-tests) [let me know how far you get on these]
Chapter 4 Gaussian Distributions Now for limit problems example 1 population statistics: A lake is stocked with trout. A biologist is able to randomly sample 42 fish in the lake (and we can assume that 42 fish are enough for proper Z-based statistics). Each fish is weighed and the average and standard deviation of the weight are 2.7 kg and 1.1 kg, respectively. If a fisherman knows that the minimum weight for keeping the fish is 2.0 kg, what percent of the time will he have to throw fish back? (assuming catching is not size-dependent) 1stpart: convert limit (2.0 kg) to normalized (Z) value: Z = (x )/ 2ndpart: use Z area to get percent
Chapter 4 Gaussian Distributions Limit problem example 2 measurement statistics: A man wants to get life insurance. If his measured cholesterol level is over 240 mg/dL (2,400 mg/L), his premium will be 25% higher. His level is measured and found to be 249 mg/dL. His uncle, a biochemist who developed the test, tells him that a typical standard deviation on the measurement is 25 mg/dL. What is the chance that a second measurement (with no crash diet or extra exercise) will result in a value under 240 mg/dL (e.g. beat the test)?
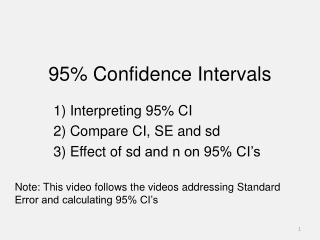
Graphical view of examples Equivalent Area Normal Distribution Table area Desired area 0.45 0.4 0.35 0.3 Frequency 0.25 0.2 0.15 0.1 0.05 0 -5 -4 -3 -2 -1 0 1 2 3 4 5 Z value X-axis 249 240
Chapter 4 Calculation of Confidence Interval 1. 2. Confidence Interval = x + uncertainty Calculation of uncertainty depends on whether is well known When is not well known (covered later) When is well known (not in text) Value + uncertainty = Normal Distribution 0.45 0.4 3. 0.35 0.3 Frequency 4. 0.25 0.2 Z 0.15 x 0.1 n 0.05 Z depends on area or desired probability At Area = 0.45 (90% both sides), 0 -3 -2 -1 0 1 2 3 Z value Z = 1.65 At Area = 0.475 (95% both sides), Z = 1.96 => larger confidence interval
Chapter 4 Calculation of Uncertainty Example: The concentration of NO3- in a sample is measured 2 times and found to give 18.6 and 19.0 ppm. The method is known to have a constant relative standard deviation of 2.0% (from past work). Determine the concentration and 95% confidence interval.