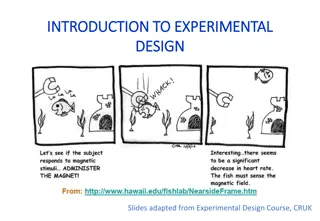
Understanding Experimental Design and Bias in Statistics
Explore key concepts in statistics such as observational studies, experiments, bias, and sampling methods. Delve into the difference between observational studies and experiments, understand the impact of bias in research, and learn about sampling techniques like simple random sampling and stratified random sampling. Gain insights into experimental design principles including randomization, blocking, and blinding.

Download Presentation

Please find below an Image/Link to download the presentation.
The content on the website is provided AS IS for your information and personal use only. It may not be sold, licensed, or shared on other websites without obtaining consent from the author. Download presentation by click this link. If you encounter any issues during the download, it is possible that the publisher has removed the file from their server.
E N D
Presentation Transcript
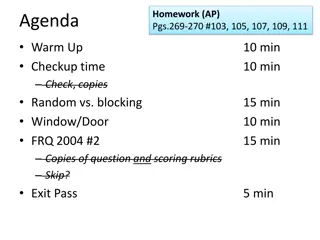
Homework (AP) Pg.226 #1-7 Agenda Warm Up Project walkthrough Population vs. sample Types of bias Copies of biased survey Hand back tests? Update Exit Pass Get chocolate for tomorrow s lesson Bring up links: http://inventorspot.com/articles/running_numbers_13954 (scroll past breasts) https://www.youtube.com/watch?v=mlq3s4ub1-Y 10 min 20 min 25 min 20 min 10 min 5 min
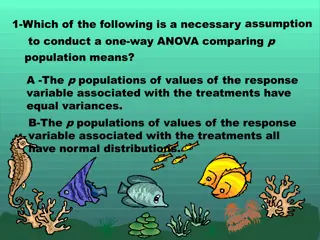
Warm Up (AP) 1. Briefly explain the difference between these terms: a. Observational study b. Experiment tinyurl.com/602seating (Test #5) A study found a correlation of r = -0.61 between the gender of a worker and his or her income. Why should these researchers lose their jobs? (Test #7) A scatterplot of a variable Y versus a variable X produces these results. What must r be? 2. 3. 4. Guess the number of plastic bottles used in the United States every 5 minutes.
Gallery Walk Windows present first Presenters spread around the room, evenly spaced Have Project with you. Doors: Say hi. Introduce yourself. Think of a unique question to ask Presenters. Make your question with sincere (rather than comical) intentions. Out of everyone currently presenting, who has the strongest relationship? What are their variables? Out of everyone currently presenting, who has the weakest relationship? What are their variables? Switch after ~10 minutes
Unit 4 Observational studies vs. experiments, conclusions drawn from each Sampling SRS (simple random sample) Everyone gets equal chance of selection Stratified random sampling, and the advantages of stratifying Types of bias Designing experiments Randomization Blocking Confounding Blinding
Warm Up 1. Briefly explain the distinction between the following terms: a. Observational study b. Experiment 2. (Test #5) A study found a correlation of r = -0.61 between the gender of a worker and his or her income. Why should these researchers lose their jobs? 3. (Test #7) A scatterplot of a variable Y versus a variable X produces these results. What must r be? 4. Guess the number of plastic bottles used in the United States every five minutes.
Video Sum: Forty Tales from the Afterlives, by David Eagleman
56% of Americans believe Elvis is alive Elvis is reported to have died in his Graceland mansion on August 16th, 1977. On the 12th anniversary of this event, a Dallas record company wanted to learn the opinions of all adult Americans on the issue of whether Elvis was really dead. They sponsored a national call-in survey. Listeners of more than 100 radio stations were asked to call a number, at a charge of $2.50, to voice their opinion concerning whether Elvis was really dead. 56% of callers thought Elvis was alive
Bad bad sampling Jacque Bourque is a medical researcher interested in the population of HIV positive individuals. They work at a clinic in Santa Barbara, and their current research project involves evaluating the health of HIV positive individuals before the onset of AIDS. Their sample consists of those HIV positive patients at the clinic who have voluntarily agreed to be part of the research project. Did they use a representative sample? Why or why not?
Notes Representative 1 of 2 Population the entire group of people or objects (observational units) of interest = mean of population = standard deviation of population Sample a small part of the population x = mean of sample s = standard deviation of sample Representative has similar characteristics to the population Example. This class might be a representative sample of: Teenagers shoe sizes. Teenagers GPA s.
Window/Door For each variable, indicate whether this class would be a representativesample of all teenagers. Justify briefly. GPA. No, not representative. This is a 4th-level math class. You re all relatively high-achieving, and have higher GPA s. 1. Hours slept last night. 2. Number of siblings. 3. Whether you prefer to call or text your friends. 4. Political viewpoint. 5. Gender. 6. Total income that you ll receive over your lifetime.
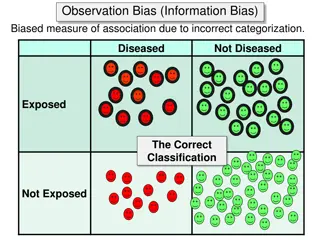
Notes Types of SAMPLING bias Selection (or undercoverage ) bias Some of population is excluded or underrepresented in selection Example: Population is teachers. Sample doesn t include math department. 2 of 2 Nonresponse bias No data is collected from individuals who have been selected. Example: Mr. Colligan is given a survey, but he s too busy to fill it out. Response bias Process distorts responses Example: Study asks employees, Considering how hard you work, don t you think it s ridiculous that you don t get free sandwiches ever day?
Example #1 (of 3) The cost of the 2010 U.S. Census was $4.5 billion, an average of $15.99 per American. The Census Bureau starts by mailing packets to everyone at their mailing address, as registered by the Internal Revenue Service. They call people who do not return the packets. They go to the addresses of people who do not return their packets or answer their phones. Representatives shall be apportioned among the several States according to their respective numbers, counting the whole number of persons in each State U.S. Constitution, Article 1, Section 2 (modified by 14th Amendment)
Example #2 (of 3) Official 2016 Democratic Party Survey
Example #3 (of 3) The 2019 Global Health Survey, from the Partners in Health organization.
I made this up. Which one is this? What They Said I ve done drugs I haven t done drugs What They Did Drugs 172 120 No drugs 13 358
Unit 3 Test Regression
70.00% 60.00% WU 50.00% 40.00% 30.00% WU 20.00% 10.00% 0.00% P.1 P.3
Common Mistakes, 1 of 2 10. The fraction of the variation in the values of y that is explained by the least-squares regression of y on x is A. the correlation coefficient. B. the slope of the least-squares regression line. C. the coefficient of determination. D. the intercept of the least-squares regression line. E. the residual. 12. The least-squares regression line is the line that A. makes the square of the correlation in the data as large as possible. B. makes the sum of the squares of the vertical distances of the data points from the line as small as possible. C. passes through the greatest number of data points. D. best splits the data in half, with half of the points above the line and half below the line. E. all of the above.
Common Mistakes, 2 of 2 17.At summer camp, one of Carla s counselors told her that you can determine air temperature from the number of cricket chirps. r = 0.461 and y = 56.23 + 0.1355x, where x is the number of cricket chirps and y is air temperature. d.) Suppose that Carla counted 249 chirps on a day when the temperature was 55 F. If this point were the 13th data point, what effect, if any, would this 13th point have on the slope and the y intercept of Carla s regression line? Explain.
Homework (AP) Pg.226 #1-7 Exit Pass The August 23, 1999, issue of the Sacramento Bee reported a study involving data volunteered by 17,251 users of the abcnews.com website. Users were asked whether or not they used the Internet to escape problems. About 6% of those responding confessed to some sort of addiction to the Internet. 1. Identify the population and sample used in this study. 2. Do you believe that 6% is a reasonable estimate of the number of Americans who have an Internet addiction? If not, indicate whether you believe this estimate is too high or too low. Explain.
")
")


")
")
")
")


")