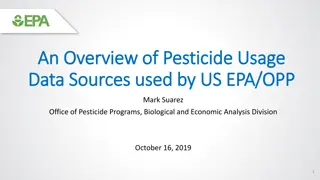
USDA Pesticide Data Program Overview

The USDA Pesticide Data Program (PDP) provides high-quality pesticide residue data for US foods to support regulatory decision-making and ensure food safety. Through cooperative agreements with participating states, the program conducts sampling of various commodities, including fresh fruits and vegetables, processed foods, grains, meats, dairy, nuts, and more. The PDP's approach involves sampling, analysis, data compilation, and public dissemination of results. By collaborating with EPA and FDA, the PDP contributes to dietary risk assessments, pesticide registration reviews, and enforcement actions. The program's sampling framework, managed by USDA's National Agricultural Statistics Service, ensures representative sampling of domestically produced and imported foods. Overall, the PDP plays a crucial role in monitoring and safeguarding the food supply in the United States.

Download Presentation

Please find below an Image/Link to download the presentation.
The content on the website is provided AS IS for your information and personal use only. It may not be sold, licensed, or shared on other websites without obtaining consent from the author. Download presentation by click this link. If you encounter any issues during the download, it is possible that the publisher has removed the file from their server.
E N D
Presentation Transcript
USDA Pesticide Data Program USDA Fruit and Vegetable Industry Advisory Committee August 14, 2019
PDP Mission Provide high quality, nationally representative pesticide residue data for US foods To fulfill USDA s responsibility under the Food Quality Protection Act of 1996 Provide EPA with data for dietary risk assessments and pesticide registration review decisions Provide information to FDA on violations Support marketing of U.S. commodities
PDP Approach Overview USDA Issues Program Plan Including Commodity Sampling Schedule All Results Compiled for Annual Summary and Made Publically Available Samples Sent to State Labs for Pesticide Residue Analysis Laboratory Results Reviewed by USDA and Entered into Database Cooperative Agreements Between USDA and States Participating States Collect Commodity Samples 3
PDP Participating States Funded through Cooperative Agreements with States State Departments of Agriculture PDP chemists serve as State liaisons PDP staff provide logistical and operative support State participating in PDP State where produce is directly marketed from participating States
Commodity and Analyte Selection Commodity and priority pesticide analytes selected by USDA in collaboration with EPA Foods tested are usually high consumption commodities with emphasis on the diets of infants and children Analytes tested are based on US pesticide registrations
PDP Commodity Counts (1991-2019) Number of Commodities Commodity Type Fresh Fruit and Vegetables 52 Processed Fruit and Vegetables 43 Grains 8 Meat/Poultry/Eggs/Fish 11 Dairy 3 Nuts/Honey 3 Water 4 Infant Formula 2 Total Number of Commodities Tested 126
Sampling Framework USDA s National Agricultural Statistics Service designs the sampling framework based on probability-proportional-to-size Represents U.S. population and therefore reflects consumption Random sampling includes domestic & imported organic & traditionally-grown foods
Sampling Timeframe High consumption commodities and foods highly consumed by infants and children are tested for 2 consecutive years Sampling rates/timeframes adjusted to reflect seasonality Rotation of high consumption items every 5 years New commodities based on data needs requested by EPA
Sampling 59 samples/commodity/month for most Equates to more than 700 samples per commodity per year Sample information captured via tablet or laptop by inspectors onsite Major food distribution centers and terminal markets Number of samples collected is apportioned according to population State Samples Per Month California 13 New York 9 Colorado 2 N. Carolina 4 Florida 7 Ohio 6 Maryland 4 Texas 8 Michigan 6 Washington 4
Sample Preparation and Extraction QuEChERS Quick Easy Cheap Effective Rugged Safe
Laboratory Analysis One or two laboratories analyze each commodity Test for 170-450 pesticides/metabolites/ isomers using Multiresidue Methods (MRMs) Lists of required compounds are commodity-specific State-of-the-art instrumentation GC/MS-MS and LC/MS-MS Very low Limits of Detection (LODs): parts-per-billion
PDP QA/QC Program Blanks, spikes, and process controls used with each sample set Method validation required for each new commodity and pesticide Limit of Detection (LOD) and Limit of Quantitation (LOQ) determined experimentally at ppb levels Participation in National and International Proficiency Testing required International accreditation required (ISO 17025)
How Are PDP Data Used? Pesticide tolerances evaluated by EPA using PDP data Pesticide uses re-registered or cancelled based on outcome of tolerance evaluations Monitor compliance with U.S. EPA tolerances and report tolerance violations to FDA Facilitate export of U.S. commodities
Dicamba Data Summary (1) Samples Analyzed Samp w/ Detects % Samp Detects Min Detect Max Detect EPA Tolerance (ppm) Commodity LOD Range Units Apples 87 0 0.006ppm NT Bananas 8 0 0.006ppm NT Blueberries, Cultivated 354 0 0.25ppm NT Blueberries, Frozen 5 0 0.25ppm NT Broccoli 8 0 0.006ppm NT Carrots 3 0 0.006ppm NT Celery 357 0 0.006 - 0.25ppm NT Grapefruit 358 0 0.25ppm NT Grapes 585 0 0.006 - 0.15ppm NT Green Beans 2 0 0.006ppm NT Lettuce 11 0 0.006ppm NT Milk 1875 0 0.004 - 0.25ppm 0.3 Nectarines 578 0 0.25ppm NT Oranges 85 0 0.006ppm NT 14
Dicamba Data Summary (2) Samples Analyzed Samp w/ Detects % Samp Detects Min Detect Max Detect LOD Range EPA Tolerance (ppm) Commodity Units Peaches 79 0 0.006ppm NT Potatoes 798 0 0.006 - 0.02ppm NT Spinach 744 0 0.02ppm NT Strawberries 2385 0 0.074 - 0.25ppm NT Summer Squash 270 0 0.25ppm NT Sweet Corn, Canned 18 0 0.006ppm Sweet Corn, Fresh 328 0 0.25ppm 0.04 Sweet Corn, Frozen 48 0 0.006 - 0.25ppm 0.04 Sweet Peas, Canned 42 0 0.006ppm Sweet Peas, Frozen 30 0 0.006ppm NT Water, Finished 1488 3 0.2 25 94 15 - 1350ppt NA Water, Groundwater 891 3 0.3 16.5 111.555 15 - 67ppt NA Water, Untreated 1468 5 0.3 25 112 15 - 1350ppt NA 15
PDP Data are All Publically Available Annual Summary Website Printed Copy Downloadable Database Data for specific commodity and pesticides PDP Database Search App o o o www.ams.usda.gov/pdp
Thank You! Contact: Brenda Foos Director, Monitoring Programs Division Pesticide Data Program Brenda.Foos@usda.gov 202-572-8167


")
")