Root Cause Analysis in Quality Improvement Projects

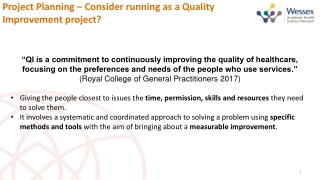
Explore the significance of analyzing root causes in quality improvement projects, with a focus on tools like fishbone diagrams. Learn why and when to conduct root cause analysis, along with various strategies and tools available for this process. Enhance your understanding of identifying and addressing underlying issues to drive improvement in healthcare settings.

Download Presentation

Please find below an Image/Link to download the presentation.
The content on the website is provided AS IS for your information and personal use only. It may not be sold, licensed, or shared on other websites without obtaining consent from the author. Download presentation by click this link. If you encounter any issues during the download, it is possible that the publisher has removed the file from their server.
E N D
Presentation Transcript
QI Brief Brief QI Root Cause Analysis in DNP Quality Improvement Projects Kathleen Buckley, PhD, RN, IBCLC Shannon Idzik, DNP, CRNP, FAANP, FAAN Jeff Martin, MBA Fall 2020
QI Brief Learning Objectives Identify why and when root causes of a problem are analyzed in a quality improvement project Use a variety of tools available for analyzing problems root causes, with emphasis on fishbone diagrams Gain access to further study and references 2
QI Brief Definition of "Root Cause" The initiating or underlying cause of a condition that leads to and outcome or effect. Example: In hospital unit X, the root cause of high medication error rates was found to be transcription errors. 3
QI Brief Root Cause Analysis Why? Accelerates the process of obtaining get clinical representative support. Aids in understanding other players perspectives on the problem Provides credibility to prioritizing the problem as a DNP project When? One of the first activities when determining a good DNP project. Also useful as reference mid-project to inform possible implementation challenges 4
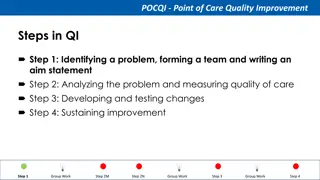
QI Brief Many Strategies to Determine Root Causes Brainstorming 5 Why's Fishbone diagram Mind mapping Logic diagrams Research historical projects 5
QI Brief Tool#1: Brainstorming Ensure creative ideas Determine your methodology Open your session with a basic set of rules: Get assistance with note taking Actively facilitate the discussion Allow time to plan next steps 6
QI Brief Tool #2: 5 Why s Requires little planning Used to complement the analysis Often used after an issue has been identified using another tool 7
QI Brief Tool #3: Fishbone Diagram Also known as Cause & Effect or Ishikawa diagram Focuses on systems and processes, not on individual performance Helps expand analysis to the overall systems impacting the problem 8
QI Brief Category Category Cause Cause Cause Cause Cause Sub-cause Problem Statement Cause Cause Cause Cause Sub-cause Sub-cause Category Category
QI Brief Category Category Cause Cause Cause Cause Cause Problem Statement Cause Cause Cause Cause Category Category
QI Brief Category Category Cause Cause Cause Cause Cause Problem Statement Cause Cause Cause Cause Common Categories Procedures Policies Communications Environment Equipment Technology Leadership Staff Support Category Category
QI Brief Category Category Cause Cause Cause Cause Cause Sub-cause Problem Statement Cause Cause Cause Cause Sub-cause Sub-cause Category Category
QI Brief Fishbone Diagram Example Leadership Environment Equipment High noise level Medication dispensing not automated location of medication room Budget constraints Why is medication error rate on unit in a Long Term Care facility higher than their peers? Pharmacist review not done before dispensing Transcription errors Medication nurses working overtime Hand written orders illegible Order entry not computerized Communication Procedures Staff
QI Brief Fishbone Diagram Example Leadership Environment Equipment Lack of privacy for pumping Low support from hospital management Mothers limited access to breast pumps Location of pumping rooms Not seen as a priority Why is breastfeeding rate at only 56% in Neonatal Intensive Care Unit? Lack of support from staff No standardized note for breastfeeding support provided by Lactation Consultant No policy on roles of support staff in promoting breastfeeding Lactation Consultant to patient ratio low Communication Staff Policy
QI Brief Next Steps Get feedback on fishbone diagram Ask for access to internal data on the practice problem Establish a relationship with your CSR by doing this through a face-to- face meeting
QI Brief Additional Resources Institute for Healthcare Improvement Fishbone Diagram Institute for Healthcare Improvement 5 Why s Six Sigma - Mind Mapping: A Simpler Way to Capture Information 16
QI QI Brief Brief Questions? Comments? Email: NRSDoctoral@umaryland.edu 17