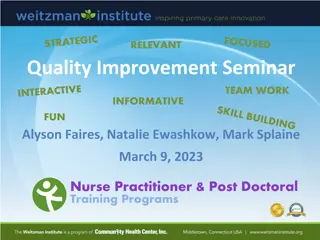
Quality Improvement Webinar on Advanced Tools - December 14, 2021
"Join us for a Quality Improvement webinar on advanced tools covering topics like stacked bar charts, histograms, fishbone diagrams, and the 5 Whys technique. Get insights into a scenario involving missed appointments and learn how data analysis can help identify patterns and solutions. Participate in interactive sessions on best practices for Zoom participation and picture consent. Enhance your QI skills with practical examples and tips."

Download Presentation

Please find below an Image/Link to download the presentation.
The content on the website is provided AS IS for your information and personal use only. It may not be sold, licensed, or shared on other websites without obtaining consent from the author. Download presentation by click this link. If you encounter any issues during the download, it is possible that the publisher has removed the file from their server.
E N D
Presentation Transcript
QI Webinar: Advance QI Tools December 14, 2021
2 Introductions Please share your name and agency in the chat room
3 Reminder about Basic Zoom Functions
4 Good Practices for Zoom Participation Re-label your Zoom tile to state your name Keep video on and mute your line when needed Use the chat room to ask for clarifications, post questions, or share your wisdom Please be reminded that we will record our session for later replay!
5 Picture Consent You allow us to take pictures from our training events and post them on SharePoint You have the right to revoke your consent for pictures that are publicly posted You allow us to take pictures from our training events and post them on SharePoint You have the right to revoke your consent for pictures that are publicly posted At no time, individual names will be used to identify you, unless you sign the appropriate release form At no time will individual names be used to identify you, unless you sign the appropriate release form
6 Advance QI Tools
7 In Today s Webinar, We Will Learn About: Stacked Bar Chart Histogram Fishbone Diagram 5 Whys
8 8 A Scenario Our organization has a high rate of missed appointments. Missed appointments lead to providers having nothing to do for a period of time. It also leads to lost revenue in some cases. The organization now wants to find out why appoints are missed, who might be missing multiple appointments and how this issue may be fixed.
9 9 First Step We need data! We catalog all the missed appointments over the past six months How would you dig deeper into the data?
10 10 Our Data Based on analysis of the records we find that: Seventy-six patients missed at least one appointment; breaking it down by sex: Forty-one males were no shows at least once Thirty-five females were no shows at least once Does this give us what we need? If not, what s the next step?
11 Deeper Dive: Stacked Bar Charts
12 12 Stacked Bar Charts You need to have a zero as baseline Can be used to convey a lot of information Should clearly show what you want it to show; Make sure of the message you want to send Don t overload it with variables Missed Appointments by Sex 30 25 8 20 6 15 15 10 17 7 15 5 5 3 0 1 2 3 4 Male # of missed appointments
13 13 What does the chart show us? Answer these questions: 1. Which sex had more missed appointments? 2. Which number of missed appointments was the largest 3. Why did so many female clients miss one appointment? a) We can t tell from this b) We need to dig deeper Missed Appointments by Sex 30 25 8 20 6 15 15 10 17 7 15 5 5 3 0 1 2 3 4 Male # of missed appointments
14 Histograms
15 15 Histograms They are similar to bar graphs, but they deal with frequency distribution, not raw numbers. Bar graphs display raw numbers, sometimes comparing variables (number of males versus females) Histograms display the number of times something occurs using one variable (age: How many clients are between 20 -29; 30 -39, etc.) They are used for continuous measures; one variable with several different values Ex: age is a measure in which you have multiple values Ex: viral suppression of each patient The more data the better; remember it s a frequency distribution
16 16 Histograms Very useful for larger data sets (50 observations or more) Gives a visual picture of the distribution of the data Clearly displays any skewing in the data (to the left or right) It s a useful decision-making tool Identifies outliers
17 17 Histograms Continuous variable think of age as a variable; there is a range of values within age but it s one variable with multiple values Bin also called a class or an interval. The bin describes its membership; for example, one of the age bins could be 18- to 24- year-old individuals Think of multiple baskets of apples; one basket has 20 apples, one has 40, etc. The basket is the bin. Frequency This is the number of times a variable occurs within a bin, such as 20 apples, having 16 clients between the ages of 18 to 24 years old
18 18 How to Construct a Histograms First, determine how many bins to use and consider Too few will clump the data together Too many will spread it out too much There is no correct number of bins; usually there are between 3 and 7 bins Next, calculate how to distribute the data in each bin; let s use age as an example. Collect the age range of each consumer Youngest is 18, oldest is 49 Let s use 6 bins for this example (arbitrarily chosen) Find the difference between the oldest and youngest consumer; in this case it s 31 years (49-18).
19 19 How to Construct Now divide the 31 by the number of bins you want and you will get 5.1666 Can you use that number? No, of course not Always round UP when you have a fraction; now we have 6 This 6 represents the range of ages in each bin, not the number of bins Let s see how this works based on what we know Our youngest consumer is 18; that s the starting point The age range for our first bin is then 18 to 23 (18,19,20,21,22,23) We then calculate the rest of them until we get to 6 bins
20 The Fishbone Diagram and the 5 Why s
21 21 Fishbone Diagrams A Root Cause Analysis Also called cause and effect diagrams, or Ishikawa Diagrams Created by Karou Ishikawa Examines the root causes of a particular problem Created by a team, preferably composed of different mind sets or skill sets (multidisciplinary) A facilitator asks why a problem exists, and the reasons are organized on the bones of the fish The facilitator may ask why several times to get to the root of the problem
22 22 Fishbone Diagrams A Root Cause Analysis (RCA) Asking Why Helps you drill down and see all the issues We will discuss a helpful Lean tool in a few minutes The more issues (bones) you address, the more stable your system will be Data are a necessary component Maintain focus on the process to be examined No process is perfect, focus on what can be controlled
23 23 The 5 Why s Read more about the Lean Tool called the 5 Whys here The 5 Why s help you drill down to the root causes of a problem This is another way to bring clarity to the fishbone diagram They help you see all the issues that may add instability to the system
24 24 Use What You Learn from The RCA In a Brainstorming Session Transportation problems seem to be the root cause of most missed appointments There are multiple transportation barriers cited that could be addressed in a quality improvement project We can use a checklist to determine which barrier occurs with the most frequency We can use a priority matrix to determine which barrier would give us the most impact and still be reasonably achieved
25 25 Use What You Learn from The RCA In a Brainstorming Session Notice how the 5 Why technique helps you drill down to root causes You need to have the right stakeholders at the table with knowledge of the process and the problems Remember that each of the items listed as root causes are part of the behavior of the overall system
26 Fishbone (Ishikawa Diagram) Processes People No follow up with pts. that missed appointments (Why?) People do not like clinic (Why?) High Rate of Missed Appointments Transportation (why?) Hours not good for working patients No late night security (Why?) Environment Resources
27 27 References Read more about the Lean Tool called the 5 Whys here QI Tools: The Memory Jogger II ASQ.org
28 Aha Moments and Wrap Up
29 Time for Some Polling Questions How helpful was today s session to learn about quality improvement? [Select one]
30 Time for Some Polling Questions How engaged were you in today s session? [Select one]
31 Time for Some Polling Questions How likely will you implement the lessons learned of this session when working with your programs? [Select one]
33 Contact Information Kevin Garrett, MSW Senior Manager, CQII New York State Department of Health AIDS Institute 90 Church Street, 13th floor New York, NY 10007-2919 Kevin.Garrett@health.ny.gov