Understanding Sound Waves and Interference through Experimentation

This activity involves studying sound waves generated by two tuning forks to create a hypothesis tested with a microphone sensor. Students explore wave behavior, classification, and interaction through hands-on experiments, enhancing their theoretical knowledge and practical understanding of wave phenomena.

Download Presentation

Please find below an Image/Link to download the presentation.
The content on the website is provided AS IS for your information and personal use only. It may not be sold, licensed, or shared on other websites without obtaining consent from the author. Download presentation by click this link. If you encounter any issues during the download, it is possible that the publisher has removed the file from their server.
E N D
Presentation Transcript
Waves Recording sound waves and sound wave interference
Waves Recording sound waves and sound wave interference Objective The purpose of this activity is to study sound waves coming from two tuning forks in order to create a hypothesis. The hypothesis will be tested by an experiment using the SensorLab microphone sensor.
Waves Recording sound waves and sound wave interference Introduction and theory The aim of the introduction is to focus students on the lesson subject by refreshing acquired knowledge and asking questions which encourage research development. Key concepts from the theoretical framework, applied by the students during the lesson, are taught. Introduction If you gently touch the surface of a cup of water with a teaspoon you ll notice an oscillatory movement on the water s surface, even though the spoon only touched one point of the cup area. This happens because when the spoon contacts the water it creates a wave that propagates through the medium. What do you know about the behavior of waves? How would you describe it? Name examples of waves that you have noticed in your daily life.
Waves Recording sound waves and sound wave interference Introduction and theory Carry out the experiment activity with your class so that at the end you ll be able to answer the following question: How do waves interact with each other?
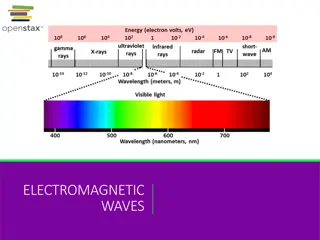
Waves Recording sound waves and sound wave interference Introduction and theory Theoretical A wave can be defined as a disturbance or variation that propagates through matters. Waves can be classified depending on the medium and on the direction they travel. According to the medium of propagation, waves can be classified into two groups: Mechanical waves and electromagnetic waves. Mechanical waves are the ones that require a medium to propagate. For example, sound waves travel through the air or some other material. On the other hand, electromagnetic waves, like light waves, don t need a medium to propagate, because they may travel through a vacuum (i.e., empty space).
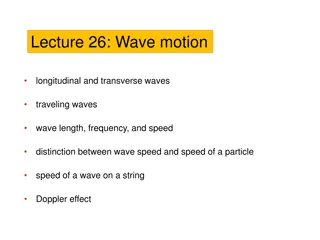
Waves Recording sound waves and sound wave interference Introduction and theory Waves can be categorized into two groups depending on the direction of their propagation in space: Longitudinal waves and transverse waves. In longitudinal waves the particles of the medium oscillate in a direction parallel to that of the wave s movement. In a transverse wave the oscillation moves in a direction perpendicular to that of the wave s movement. Longitudinal
Waves Recording sound waves and sound wave interference Introduction and theory Below are key scientific terms that relate to waves: Wave train (or wave packet): Series of waves travelling in the same direction and spaced at regular intervals, like a wagon train. Node: Region where the disturbance of the wave is almost zero (point of minimum vibration). Amplitude (A): Usually this term refers simply to the maximum positive displacement from the rest position. Crest: Point of the wave that exhibits the maximum amount of positive or upward displacement from the equilibrium position. Trough: Point of the wave that exhibits the maximum amount of negative or downward displacement from the rest position. Period (T): Time it takes for a wave to complete a single cycle, measured in unit seconds.
Waves Recording sound waves and sound wave interference Introduction and theory Frequency (f): Equal to the reciprocal of the period, frequency refers to how many waves are made per time interval (usually per second) and measured in unit Hertz (Hz). Wave length ( ): Distance between any two adjacent corresponding points on the wave train. Speed of a wave (v): Distance ( ) traveled by a given point on the wave in a given interval of time (T). In equation form:
Waves Recording sound waves and sound wave interference Introduction and theory If you remember that period and frequency are reciprocal to each other, you can easily obtain the following expression:
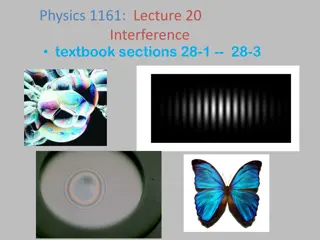
Waves Recording sound waves and sound wave interference Introduction and theory When there is more than one wave in the same space and time interferences can occur which may be constructive or destructive. Constructive interference occurs when two waves are superimposed on each other as an addition, either crest over crest or trough over trough. In this case, the final wave has greater amplitude than the original waves, because the amplitude of both is added. On the other hand, destructive interference occurs when the crest of one wave meets the trough of the other. In this case, the final wave has smaller amplitude because a positive altitude is summed to a negative altitude, in other words this addition looks like a subtraction. As we mentioned before, sound is a form of mechanical wave caused by the vibration of a body. Sound travels in space as longitudinal waves, causing a back and forth oscillation of the particles of the medium. Since this oscillation causes temporal changes in air density, high-pressure and low-pressure regions are formed, related to the maximum distance of the particle movement (amplitude).
Waves Recording sound waves and sound wave interference Introduction and theory Therefore, sounds are classified as loud or weak depending on the magnitude of amplitude, referring to the sound intensity. Sound intensity is defined as the amount of acoustic energy that is transported past a given area of the medium per unit time (second). Acoustic energy depends on acoustic power. Wave amplitude and acoustic power are directly proportional to each other, i.e. the higher the altitude the greater the acoustic power. You can conclude accordingly that wave amplitude and sound wave intensity are directly proportional. For this reason, we will use sound wave intensity in unit decibels (dB) as equal to amplitude, even if we know them to be different concepts. Now students are encouraged to raise a hypothesis which must be tested with an experiment. Let s record a sound wave. How do you think a sound wave will look? Do you think that two waves of a similar nature, coming from two different sound sources, will interact with each other?
Waves Recording sound waves and sound wave interference Activity description Students will measure the sound wave by placing the SensorLab microphone near one tuning fork A440 (f=440Hz). Then they will use another tuning fork at a slightly different frequency, record both tuning forks at the same time and analyze the sound wave interference.
Waves Recording sound waves and sound wave interference Resources and materials SensorLab USB connector cable SensorLab holder 2 tuning forks A440 1 metal ring for changing tuning fork frequency 2 resonance boxes 1 beater
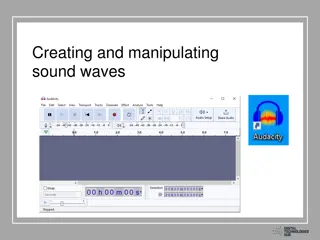
Waves Recording sound waves and sound wave interference Using the SensorLab a. Using the SensorLab To collect measurements with the microphone sensor, the SensorLab must be set up according to the following steps: Turn on the SensorLab by pressing Open the GlobiLab program. To perform this activity we recommend using wireless communication. If your computer does not support Bluetooth, you may use USB connection. Please refer to the Quick Start Guide, supplied with the SensorLab for instructions on how to set Bluetooth communication and pair your device with the computer.
Waves Recording sound waves and sound wave interference Using the SensorLab When using the Bluetooth communication: Right click on the Bluetooth icon in the bottom right corner of the GlobiLab s screen and select the SensorLab you are using. The icon will change from grey to blue, indicating that the SensorLab and the computer are now connected via Bluetooth communication. When using the USB communication: Connect the SensorLab and the computer with the USB cable supplied with the SensorLab. Click on the USB icon in the bottom right corner of the GlobiLab screen. The icon will turn blue, indicating that the SensorLab is connected to the computer via USB.
Waves Recording sound waves and sound wave interference Using the SensorLab Click on the button to configure the SensorLab. On the Logger setup window select microphone sensor, -25000/sec- in rate and - 1000 - samples .
Waves Recording sound waves and sound wave interference Experiment 1 The following steps explain how to perform the experiment: We will first record one tuning fork. Insert the tuning fork into the resonance box. Place the SensorLab about 10 centimeters away from the resonance box.
Waves Recording sound waves and sound wave interference Experiment 1 Hit the tuning fork with the beater and wait 1 to 2 seconds for the sound to stabilize. Press the RUN icon in the GlobiLab software. The SensorLab will record 1000 samples in less than a second and then automatically upload all samples to the GlobiLab software.
Waves Recording sound waves and sound wave interference Results and analysis The following steps explain how to analyze the experiment results: If the the SensorLab sample did not upload automatically, press the download button Observe the graph displayed on the screen. Click the button to zoom in on a section of the graph. Press the button and write notes on the graph specifying the maximum and minimum amplitude value. Press to select two points on the graph, representing the beginning and end of a single oscillation. Use the time values provided to calculate the period and frequency of the selected wave.
Waves Recording sound waves and sound wave interference Results and analysis What does a sound wave look like? Which frequency did you obtain?
Waves Recording sound waves and sound wave interference Results and analysis The graph below should be similar to the one the students came up with.
Waves Recording sound waves and sound wave interference Experiment 2 The following steps explain how to perform the experiment: In this experiment we will record two tuning forks at slightly different frequencies. Use the previous SensorLab SETUP while changing the number of samples to 10,000. See the SETUP screen below.
Waves Recording sound waves and sound wave interference Experiment 2 Insert the 2nd tuning fork into the 2nd resonance box. Secure the tuning fork metal ring in the center of the 2nd tuning fork (this will slightly change it s frequency). Place the tuning forks 20 centimeters away from each other, where both resonance boxes are open and facing each other. Place the SensorLab microphone in the center between the tuning forks. Hit both tuning forks with the beater and wait 1 to 2 seconds for the sound to stabilize. Press the RUN icon in the GlobiLab software. The SensorLab will record 10000 samples in less than a second and then automatically upload all samples to the GlobiLab software.
Waves Recording sound waves and sound wave interference Results and analysis The following steps explain how to analyze the experiment results: If the SensorLab sample did not upload automatically, press the download button Observe the graph displayed on the screen. Click the button to zoom in on a section of the graph. Press the button and write notes on the graph specifying the maximum and minimum amplitude values. Press to select two points on the graph, representing the beginning and end of a single oscillation. Use the time values provided to calculate the period and frequency of the selected wave.
Waves Recording sound waves and sound wave interference Results and analysis How do your results relate to your original hypothesis? Where would you mark maximum amplitude and minimum amplitude? Where would you mark constructive interference and destructive interference?
Waves Recording sound waves and sound wave interference Results and analysis The graph below should be similar to the one the students came up with.
Waves Recording sound waves and sound wave interference Conclusions Following are some questions and answers which should be developed by students in order to elaborate on their conclusions. What is a wave? Students should explore the concepts in the theoretical background, explaining that a wave is a perturbation of the medium that travels from its source in all directions. Describe a sound wave mentioning the medium and the propagation direction. Students should indicate that, relating the medium of propagation, sound waves are mechanical waves. According to the propagation direction, we can categorize them as longitudinal waves.
Waves Recording sound waves and sound wave interference Conclusions According to the graph, what kinds of interferences did you record? Why did these interferences appear? Students should analyze the graph and observe the wave amplitude variation in time. They should establish that the amplitude increases and decreases alternatively, concluding that the experiment registered both constructive and destructive interference. Constructive interference occurred because the crest of one wave superimposed over the crest of the other. The destructive interference was the product of a wave trough superimposing over the crest of another. Which of the concepts mentioned in the theoretical background can be obtained from the graph? Students should understand the concepts mentioned in the theoretical background. They should use the graph to obtain the necessary parameters to calculate its values. As the y axis on the graph displays sound wave intensity and the x axis displays time in seconds, students should be able to obtain several characteristics such as amplitude, trough, crest, period and frequency.
Waves Recording sound waves and sound wave interference Conclusions Students should reach the following conclusions: We can describe the anatomy of waves by naming the parts of it, for example: wave train, node, amplitude, period and wavelength. Besides the direct information that may be extrapolated from a graph, we can also calculate some parameters indirectly. In this way we can obtain frequency and speed of propagation. When there is more than one wave in the same space and time, interferences can occur which may be constructive or destructive. Constructive interference occurs when two waves are superimposed on each other as an addition, either crest over crest or trough over trough. In this case, the final wave has greater amplitude than the original waves, because the amplitude of both is added. Both types of interference were observed during the experiment.
Waves Recording sound waves and sound wave interference Activities for further application The aim of this section is for students to extrapolate the acquired knowledge during this class through its application in different contexts and situations. Furthermore, it is intended that students question and present possible explanations to the experimentally observed phenomena. Further questions: If the speed of a wave s propagation is 400 m/s and its wavelength is 1.2 m, calculate the wave period. Students should use the concepts explored during the class to answer this physics problem. They should extract the variables needed to solve the problem and identify correctly the unknown factor. Following is the problem s solution:
Waves Recording sound waves and sound wave interference Activities for further application Solution: If you remember: You can rearrange the expression to become: Using the data of the problem statement you can obtain the value of the unknown factor:
Waves Recording sound waves and sound wave interference Activities for further application Match the concepts on the left to the corresponding statement on the right. Frequency Can travel through empty space (vacuumed) Mechanical wave Distance between two consecutive crests or troughs Crest Electromagnetic wave Wave Its unit of measurement is Hertz Amplitude Packets of waves moving together Wave train Needs matter to propagate Speed of propagation Highest point of a wave Electromagnetic wave Maximum distance of a wave from the equilibrium point Wavelength Sound wave Longitudinal wave Perturbation that travels through space Transversal wave
Waves Recording sound waves and sound wave interference Activities for further application Students should apply their knowledge and obtain following matches: = = = = = = = = = = =
Waves Recording sound waves and sound wave interference Activities for further application Find and write down the following concepts in the figure: Wave train, amplitude, trough, node, equilibrium line and wavelength. Students should label the figure characterizing the wave with the concepts they have learned during the class. They should obtain an image similar to the one presented in the theoretical background.