Understanding Unemployment Rates and Labor Statistics Methodology

Explore the concept of unemployment rate, its measurement, official definitions, and additional details such as the employment status of the Montana population. Learn about different categories of unemployment and gain insights into the factors influencing labor statistics methodology.

Download Presentation

Please find below an Image/Link to download the presentation.
The content on the website is provided AS IS for your information and personal use only. It may not be sold, licensed, or shared on other websites without obtaining consent from the author. Download presentation by click this link. If you encounter any issues during the download, it is possible that the publisher has removed the file from their server.
E N D
Presentation Transcript
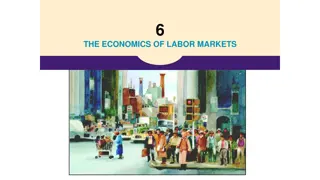
Reservation Labor Statistics Methodology State-Tribal Relations Committee October 21, 2015 Helena, MT Barbara Wagner Chief Economist
Unemployment Rate percent of the labor force looking for work ?????????? ??????? ????? ????? ???????????? ???? =
Simplified Formula Unemployment Rate = f(Last Month Unemployment Rate, State Trend, National and Regional Trends, Household Survey, Unemployment Claims, Employer Survey, Seasonal Error, Measurement Error, Survey Error) Additional Reading: LAUS Estimation Methodology, http://www.bls.gov/lau/laumthd.htm and Pfeffermann and Tiller, 2002, http://eprints.soton.ac.uk/198/1/198-01.pdf
What does the Unemployment Rate Measure? The unemployment rate measures how hard it is to find a job if you are looking for a job. Measures changes in the economy Relative measure Rarely will exceed 20% At higher rates, people will stop looking for a job Higher rates usually indicate wars, dramatic shocks
Official Definitions 1. Not Currently Working 2. Were available for Work 3. Made Efforts to Find Work (or were waiting to be recalled) Unemployed 1. Did at least 1 hour of work for pay or in their own business, or 15 hours unpaid in family enterprise 2. With job, but out sick/ injured/ labor dispute/ childcare problems Employed Labor Force 1. Either unemployed or employed
Employment Status of the Montana Population In school Other 2%2% Caring for family 3% Disabled 4% Retired 20% Employed 48% 48% 19% Under 16 Unemployed 2% Source: Current Population Survey Microdata 2017-2023, IPUMS
What about the rest of people? U1 Unemployed 15 weeks or longer U2 Job losers, including temporary workers U3 Official Rate, total unemployed U4 Unemployed plus discouraged workers U5 Unemployed, discouraged, and marginally attached U6 Unemployed, discouraged, marginally attached and part- time for economic reasons
Alternative Measures of Unemployment For Montana 18.0 16.0 U-1 U-2 U-3 U-4 U-5 U-6 14.0 12.0 10.0 8.0 6.0 4.0 2.0 0.0 Source: LAUS, Alternative Measures of Labor Underutilization for State, BLS
Other Employment Metrics: Labor Force Participation Rates Percent of the population over 16 in the labor force Used as a measure of economic engagement Affected by economic performance, age demographics, wages, and more Labor Force Participation Rates in Montana by Select Demographics 70% 60% 50% 40% 30% 20% 10% 0% Total Women American Indian Veteran Disability Less than High School Source: Current Population Survey 2017-2023
Labor Force Participation in Montana Affected by both Recession and Demographics Montana and U.S. Labor Force Participation Rates Since 1976 70% 69% 68% 67% 66% 65% 64% MT 62.6% 63% 62% US 62.6% 61% 60% 2008 1976 1978 1980 1982 1984 1986 1988 1990 1992 1994 1996 1998 2000 2002 2004 2006 2010 2012 2014 2016 2018 2020 2022 Source: Local Area Unemployment Statistics for Montana and Current Population Survey for U.S., Bureau of Labor Statistics and MT Dept of Labor and Industry (MT DLI)
Other Employment Metrics Employment to Population Ratios Percent of population who are employed (needs Census data) Affected by demographics Sometimes adjusted for demographics using just people 16 to 64 years of age Combination of labor force participation and unemployment rates Better measure for persistently poor economic conditions, but not a measure of economic changes
Employment to Population Ratio Employment Status of Montanans over 16, 2017-2023 Employment Status of Population 16 and Over 100% Not Sure, 1.5% Not Sure, 4.7% Family Care, 3.7% In School, 3.7% Family Care, 8.2% Disabled or Long-term Illness, 4.6% 90% Blue In School, 8.7% 80% represents not in Labor Force Disabled or Long-term Illness, 8.8% Retired, 22.5% 70% Retired, 9.5% Unemployed, 1.9% 60% Unemployed, 5.8% 50% 40% Employed, 62.1% 30% Employed, 54.2% 20% 10% 0% All Montanans American Indians Source: Current Population Survey microdata compiled by MT DLI using monthly data from Jan 2017 to Dec 2023
Why is it so hard to measure reservation economies? 1. Small populations require costly and large samples 2. Rural areas have the highest data collection costs due to population density 3. Flaws in one data source affect other data 4. Sovereignty requires cooperation between governments
Step 1: National Unemployment Rate Larger populations require lower relative sample sizes Reduces cost of producing labor statistics Estimated from the Current Population Survey Telephone Survey about 60,000 households (110,000 people) 740 households in Montana Cluster-based design using Census population data
Step 2: Divvy Employment out to States Based on State-Level Data Montana is too small of a population / sample to produce estimates with telephone survey. Supplemental data needed. 1. Current Population Data (national survey) 2. Current Employment Estimates Survey of 3,600 Montana employers each month Most reported automatically by national employers 3. Unemployment Insurance Claims Only about 30% to 40% of unemployed people receive claims Most important for tracking sudden changes, like layoffs
Data Sources Used in Creating the State Unemployment Rate Quarterly Census of Employment and Wages Census Population Counts Current Employment Statistics Current Population Survey (Household Survey) (Employer Survey) Unemployment Insurance Claims National Unemployment Rate
Step 3: Divvy Employment / Unemployed out to Local Areas County cannot have more jobs than people Know the number of people based on Census Population Data Employment initially allocated to counties based on annual employment counts from Quarterly Census of Employment and Wages (and other data). Mandatory reporting of employment for UI purposes Census of all payroll employment, not survey estimate Change in initial level based on claims and employer survey
Step 4: Allocate County Employment/ Unemployment to Reservations Use ratios from American Community Survey data to allocate employed / unemployed Uses population shares from 2009-2013 ACS. BLS plans to update population shares in 2025
Step 4: Continued Use ratios from American Community Survey data to allocate BLS employed / unemployed
2022 Unemployment Rates for Regions and Reservations
Step 5: End of Year Benchmarking Use known employment totals from Quarterly Census of Employment and Wages to re-estimate monthly data Reduce variance and better allocation to local areas Update population controls Re-estimate data Reduces variance and improves trend accuracy
Criticisms This method is obviously not perfect for Montana s small populations. Data collection challenges in rural areas, especially reservations Tribal sovereignty removes some data No data collected on tribe or race
Criticisms: Step 1: National Unemployment Rate Estimated from the Current Population Survey Telephone Survey about 60,000 households (110,000 people) 740 households in Montana Concerns about the use of telephones on reservations Cluster-based design using Census population data Larger populations require lower relative sample sizes Reduces cost of producing labor statistics Over-sample reservation areas, but still small population
Criticisms: Step 2: Divvy Employment out to States Based on State-Level Data Montana is too small of a population / sample to produce estimates only on telephone survey. Supplemental data needed. 1. Current Employment Estimates Survey of 3,600 Montana employers each month Most reported automatically by national employers 2. Unemployment Insurance Claims Only about 30% to 40% of unemployed people receive claims Most important for tracking sudden changes, like layoffs
Criticisms on Step 3: Divvy Employment / Unemployed out to Local Areas County cannot have more jobs than people Know the number of people based on Census Population Data Tax Records Used in Many Federal Data Programs Employment initially allocated to counties based on annual employment counts from Quarterly Census of Employment and Wages (and other data). Mandatory reporting of employment for UI purposes Census of all payroll employment, not Census Won t mail to PO Boxes in Rural Areas Reporting often Change in initial level based on claims and employer survey incomplete or delayed
Criticisms on Step 4: Allocate County Employment/ Unemployment to Reservations Use ratios from American Community Survey data to allocate employed / unemployed This method actually makes sense and seems to do a good job of representing economies.
Benefits of Monthly Unemployment Rate Metrics using BLS Methodology Ability to compare to other areas Consistent measurement across time Ability to measure effectiveness of interventions More timely than every five years
Over-the-year Change in Employment on Montana s Reservations Source: Local Area Unemployment Statistics, Montana Dept of Labor and Industry
Possible Alternatives and Improvements 1. Census Bureau Unemployment Rates
Possible Alternatives and Improvements 2. Bureau of Indian Affairs Labor Market Survey Did own data collection, but last published in 2005 Now using Census Data 2005 Data had significant differences to BLS data Included American Indians only Did not remove retired, homemakers, or students. Some disabled removed. More like an employment to population ratio than an unemployment rate Work needed to be for money, not compensation
Possible Alternatives and Improvements: Bureau of Indian Affairs, Cont. 2013 Report using Census data has lots of great information, but not unemployment rates. In their own words (pg 9): It is very important to note that this report does not provide any estimates of unemployment. Unemployment, refers to the proportion of people in the labor force who are not working .This measurement standard has long been established in the Federal Statistical System. The above-mentioned standard definition of unemployment does not reflect any judgment as to whether people who are not working, and who want a job, should be actively looking for work. Indeed, it may well be the case that there are no job opportunities in certain areas of Indian Country, thereby making it pointless, or perhaps even irrational, for anyone without a job under these circumstances to be continually and actively looking for one in the same, economically depressed, geographic area. Therefore, none of the statistics provided in this report should be seen as reflecting or representing estimates of unemployment. Anyone who uses the statistics provided in this report to infer any statement about unemployment with regard to any individual tribe, with regard to the tribes in a state or region, or with regard to Indian Country overall, will be misinterpreting and misrepresenting the findings of this report. U.S. Department of Interior, Indian Affairs Report can be found at www.bia.gov/cs/groups/public/documents/text/idc1-024782.pdf
MORE INFORMATION AVAILABLE: WWW.LMI.MT.GOV