Economics of Labor Markets: Factors of Production and Labor Demand

The Economics of Labor Markets explores the markets for factors of production such as labor, land, and capital. Demand for these factors is derived from firms' decisions to produce goods. The labor market, governed by supply and demand forces, exhibits diminishing marginal product of labor due to fixed resources. Competitive firms decide labor hiring based on marginal product.

Download Presentation

Please find below an Image/Link to download the presentation.
The content on the website is provided AS IS for your information and personal use only. It may not be sold, licensed, or shared on other websites without obtaining consent from the author. Download presentation by click this link. If you encounter any issues during the download, it is possible that the publisher has removed the file from their server.
E N D
Presentation Transcript
6 THE ECONOMICS OF LABOR MARKETS
Chapter 18: The Markets for the Factors of Production Introduction to Microeconomics Udayan Roy
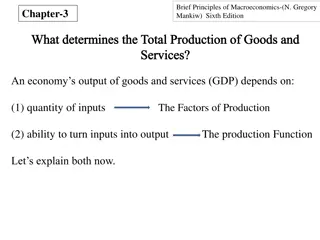
The Markets for the Factors of Production Factors of production are the inputs used to produce goods and services Examples: labor, land, and capital (machines, tools, factory buildings)
The Markets for the Factors of Production The demand for a factor of productionis a derived demand. A firm s demand for a factor of production is derived from its decision to supply the good that is produced with that factor.
THE DEMAND FOR LABOR Labor markets, like other markets in the economy, are governed by the forces of supply and demand.
Figure 1 The Versatility of Supply and Demand Figure 1 The Versatility of Supply and Demand (a) The Market for Apples (b) The Market for Apple Pickers Price of Apples Wage of Apple Pickers Supply Supply P W Demand Demand Quantity of Apples Quantity of Apple Pickers 0 Q 0 L
The Production Function and the Marginal Product of Labor The production function describes the relationship between the quantity of inputs used and the quantity of output produced. See Chapter 13 for a recap
Table 1 How the Competitive Firm Decides How Much Labor to Hire Note that the MPL decreases as more workers are hired. This reflects diminishing returns. Note that the wage paid by the firm does not depend on the number of workers hired. This implies perfect competition in the labor market.
Diminishing Marginal Product of Labor As the number of workers increases, the marginal product of labor decreases. Why? The amount of some resources called fixed resources cannot be increased in the short run. Therefore, any increase in the amount of labor implies that there is less of the fixed resources for each worker to work with. This leads to diminishing marginal product of labor.
The Value of the Marginal Product and the Demand for Labor VMPL is the additional revenue from the output produced by an additional worker. VMPL = MPL P Example: If a worker adds 20 cookies to a cookie producer s hourly output, her MPL = 20 cookies per hour. If the sale price of each cookie is P = $0.50, the worker contributes 20 0.50 = $10 per hour to the firm s revenues. So, her VMPL = $10 per hour. Note that a worker s VMPL is also the firm s willingness-to-pay for the worker.
The Value of the Marginal Product and the Demand for Labor VMPL = MPL P VMPL decreases as the number of workers increases because MPL, the marginal product, decreases and P, the market price of the good, stays constant.
The Value of the Marginal Product and the Demand for Labor To maximize profit, the competitive, profit-maximizing firm hires workers up to the point where the value of the marginal product of labor equals the wage. VMPL = Wage
Figure 3 The Value of the Marginal Product of Labor Figure 3 The Value of the Marginal Product of Labor Note that the VMPL curve tells us how many workers the firm will hire at different wage rates. Therefore, the VMPL curve is actually the labor demand curve. wage w2 w1 Value of Marginal Product of Labor or Firm s willingness-to- pay for labor L1 L2 Quantity of Apple Pickers 0 0
Figure 3 The Value of the Marginal Product of Labor Figure 3 The Value of the Marginal Product of Labor Value of the Marginal Product Market wage Value of marginal product (demand curve for labor) Number of Apple Pickers 0 0 Profit-maximizing quantity
Figure 3 The Value of the Marginal Product of Labor Figure 3 The Value of the Marginal Product of Labor Value of the Marginal Product Market wage VMPL = MPL P (demand curve for labor) Number of Apple Pickers 0 0 Profit-maximizing quantity
What Causes the Labor Demand Curve to Shift? Changes in P, the produced good s price Changes in MPL. This is caused by: Technological Change Changes in the amounts of the other factors being used alongside labor
THE SUPPLY OF LABOR The labor supply curve reflects how workers decisions about the labor-leisure tradeoff respond to changes in the wage. An upward-sloping labor supply curve means that an increase in the wages induces workers to increase the quantity of labor they supply.
Figure 4 Equilibrium in a Labor Market Figure 4 Equilibrium in a Labor Market Wage (price of labor) Supply Quantity of Labor 0
Supply Curve = Marginal Cost Curve We saw in Ch. 14 that a firm s supply curve (of a produced good) is essentially its marginal cost curve The same idea applies in the case of labor supply as well A worker s labor supply curve is the worker s marginal cost of working another hour CHAPTER 18 THE MARKETS FOR THE FACTORS OF PRODUCTION
Figure 4 Equilibrium in a Labor Market Figure 4 Equilibrium in a Labor Market $ MCL = Supply The pain and suffering of having to work another hour is $8.00 Therefore, this worker will work 40 hours a week when the wage is $8.00 per hour 8.00 Therefore, the MCL curve shows the worker s supply of labor Quantity of Labor 0 40 hours per week
A backward-bending labor supply? At high wages, the quantity of labor supplied might decrease when the wage increases Example: Suppose $1000 a week is enough for Jim. Also, Jim enjoys spending time with his family When Jim s wage rises from $20 per hour to $25 per hour, he, therefore, reduces his time at work from 50 hours a week to 40 hours a week CHAPTER 18 THE MARKETS FOR THE FACTORS OF PRODUCTION
What Causes the Labor Supply Curve to Shift? Changes in attitudes towards work Changes in alternative work opportunities Immigration
EQUILIBRIUM IN THE LABOR MARKET The wage adjusts to balance the supply and demand for labor. As the labor demand curve is also the VMPL curve, the wage equals the value of the marginal product of labor; w = VMPL.
Figure 4 Equilibrium in a Labor Market Figure 4 Equilibrium in a Labor Market Wage (price of labor) Supply Equilibrium wage, W Demand Quantity of Labor 0 Equilibrium employment, L
EQUILIBRIUM IN THE LABOR MARKET Shifts in the supply curve or shifts in the demand curve for labor cause the equilibrium wage to change.
Figure 5 A Shift in Labor Supply Figure 5 A Shift in Labor Supply Wage (price of labor) 1. An increase in labor supply . . . Supply, S S W W 2. . . . reduces the wage . . . Demand Quantity of Labor 0 L L 3. . . . and raises employment.
Figure 6 A Shift in Labor Demand Figure 6 A Shift in Labor Demand Wage (price of labor) Supply W 1. An increase in labor demand . . . W 2. . . . increases the wage . . . D Demand, D Quantity of Labor 0 L L 3. . . . and increases employment.
Table 2 Productivity and Wage Growth in the United States Growth in productivity is measured here as the annualized rate of change in output per hour in the nonfarm business sector. Growth in real wages is measured as the annualized change in compensation per hour in the nonfarm business sector divided by the implicit price deflator for that sector. These productivity data measure average productivity the quantity of output divided by the quantity of labor rather than marginal productivity, but average and marginal productivity are thought to move closely together. CHAPTER 18 THE MARKETS FOR THE FACTORS OF PRODUCTION
OTHER FACTORS OF PRODUCTION: LAND AND CAPITAL Capital refers to the equipment and structures used to produce goods and services. The economy s capital represents the accumulation of goods produced in the past that are being used in the present to produce new goods and services.
OTHER FACTORS OF PRODUCTION: LAND AND CAPITAL Prices of Land and Capital The purchase price is what a person pays to own a factor of production indefinitely. The rental price is what a person pays to use a factor of production for a limited period of time.
Equilibrium in the Markets for Land and Capital The rental price of land and the rental price of capital are determined by supply and demand exactly as in the case of the wage of labor. The firm increases the quantity hired until the value of the factor s marginal product equals the factor s price. Rental price of land = VMP of land Rental price of capital = VMP of capital
Figure 7 The Markets for Land and Capital Figure 7 The Markets for Land and Capital (a) The Market for Land (b) The Market for Capital Rental Price of Land Rental Price of Capital Supply Supply P P Demand Demand Quantity of Quantity of Capital 0 Q 0 Q Land
Linkages among the Factors of Production Factors of production are used together. The marginal product of any one factor depends on the quantities of all factors that are available.
Linkages among the Factors of Production A change in the supply of one factor alters the earnings of all the factors.
Linkages among the Factors of Production A change in earnings of any factor can be found by analyzing the impact of the event on the value of the marginal product of that factor.
The Black Death (1347-1350) One-third of Europe s population was wiped out by the bubonic plague. Our theory implies: A rise in wages for the surviving workers A fall in the marginal product of land and, therefore, a fall in the value of the marginal product of land, which is also the rent of land This is what actually happened: Wages approximately doubled Land rents were approximately halved CHAPTER 18 THE MARKETS FOR THE FACTORS OF PRODUCTION
Any Questions? CHAPTER 18 THE MARKETS FOR THE FACTORS OF PRODUCTION
Summary The economy s income is distributed in the markets for the factors of production. The three most important factors of production are labor, land, and capital. The demand for a factor, such as labor, is a derived demand that comes from firms that use the factors to produce goods and services.
Summary Competitive, profit-maximizing firms hire each factor up to the point at which the value of the marginal product of the factor equals its price. The supply of labor arises from individuals tradeoff between work and leisure. An upward-sloping labor supply curve means that people respond to an increase in the wage by enjoying less leisure and working more hours.
Summary The price paid to each factor adjusts to balance the supply and demand for that factor. Because factor demand reflects the value of the marginal product of that factor, in equilibrium each factor is compensated according to its marginal contribution to the production of goods and services.
Summary Because factors of production are used together, the marginal product of any one factor depends on the quantities of all factors that are available. As a result, a change in the supply of one factor alters the equilibrium earnings of all the factors.


")