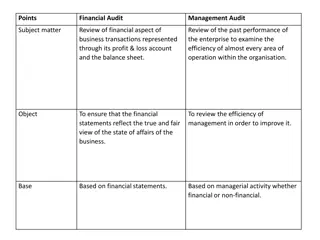
Financial Planning and Control in Business
Financial planning involves projecting sales, income, and assets to determine the resources needed to achieve goals. Financial control focuses on implementing plans, receiving feedback, and making adjustments. Growth should not be the sole goal; shareholder value creation is key. The percentage of sales method aids in forecasting additional funds needed from external sources for business expansion.

Download Presentation

Please find below an Image/Link to download the presentation.
The content on the website is provided AS IS for your information and personal use only. It may not be sold, licensed, or shared on other websites without obtaining consent from the author. Download presentation by click this link. If you encounter any issues during the download, it is possible that the publisher has removed the file from their server.
E N D
Presentation Transcript
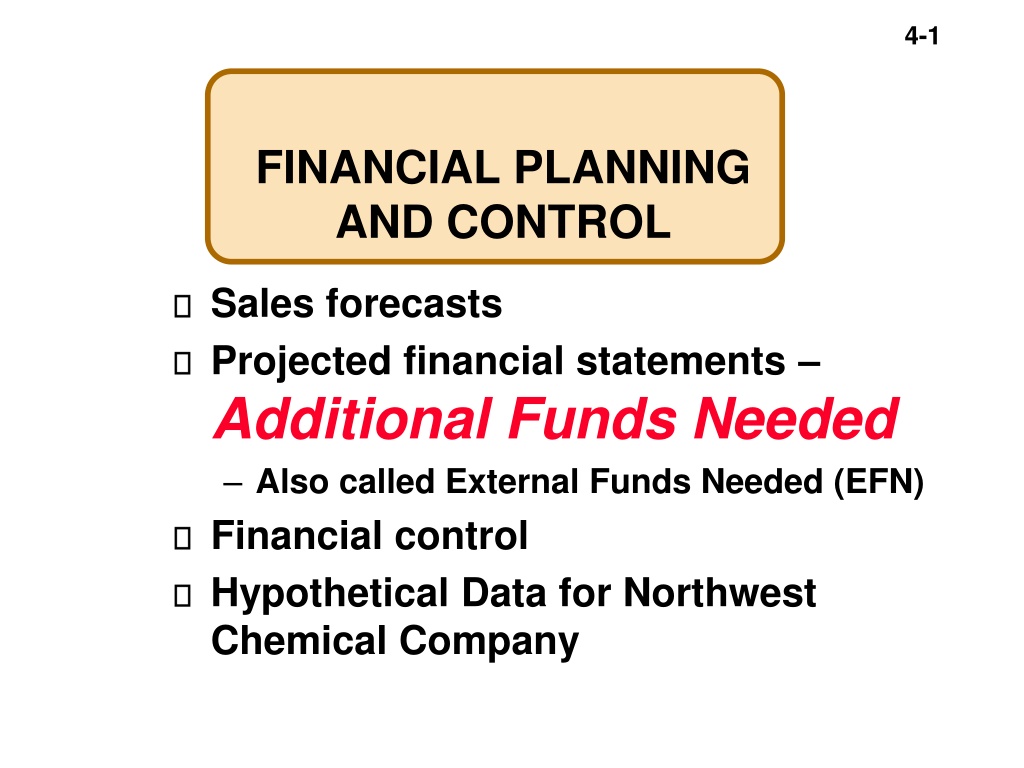
4-1 FINANCIAL PLANNING AND CONTROL Sales forecasts Projected financial statements Additional Funds Needed Also called External Funds Needed (EFN) Financial control Hypothetical Data for Northwest Chemical Company
4-2 Financial Planning and Control Financial Planning The projection of sales, income, and assets based on alternative production and marketing strategies, as well as the determination of the resources needed to achieve these projections. planning and human resource planning. Forecasting also is important for production Financial Control The phase in which financial plans are implemented; control deals with the feedback and adjustment process required to ensure adherence to plans and modification of plans because of unforeseen changes.
4-3 Financial Planning: Growth is a key theme behind financial forecasting. Remember that growth should not be the underlying goal of a corporation creating shareholder value is the appropriate goal. In many cases, however, shareholder value creation is enabled through corporate growth. The sales forecast predicts a firm s unit and dollar sales for some future period; generally based on recent sales trends plus forecasts of the economic prospects for the nation, region, industry, etc. We want to determine if we need external funds borrowing or a new stock issue
4-4 Percentage of Sales Method 1. Projected Balance sheet forecasting of AFN 2. Increased sales requires increased assets that must be financed. We will discuss the strategy for forecasting assets. 3. Increased sales automatically increases spontaneous liabilities. 4. Some financing will come from retained earnings. Depending on the information, we formulate a strategy for determining RE. 5. If additional funds are needed we have to choose to finance with external funds -- debt or stock. 6. #5 affects #4 -- thus, we sometimes use an iterative approach to refine the estimate.
4-5 Projected balance sheet A = L + OE on a balance sheet If A = L + OE both at the beginning and end of an accounting period Then A = L + OE Which is the fundamental basis for the sources and uses of funds statements In other words the accounting works right The concern is about acquiring outside capital Debt and Equity Bond issue or loans Stock Issue External sources take a lead time and planning
4-6 Steps to get AFN simple one-pass forecast balance sheet method 1. Calculate RE with the data given (method varies) 2. Increase CA and spontaneous liabilities proportionately with sales 3. Increase FA if needed based on capacity information given 4. Carry over bonds/bank-loans and stock 5. Calculate TA - (TL+E) = AFN AFN = additional funds needed from external sources
4-7 Hand out simple example
4-8 Two pass method example: Northwest Chemical: next year s Sales Projection (millions of dollars) $3,000 $2,500 $2,000 $1,500 $1,000 $500 $0 1996 1997 1998 1999 2000 2001
4-9 Northwest Chemicals Oregon producer of Ag Chemicals Prepare financial forecast, main assumption is a 25% increase in sales Want to know how performance/ratios changes. One of the main items is Additional Funds Needed We will use the percentage of sales method of forecasting financial statements. This will give you a thorough feel for the process of forecasting financial statements.
4-10 North West Chemical: Key Ratios last year NWC 2.52% 7.20% 43.2 days 5.00x 4.00x 2.00x 30.00% 6.25x 2.50x 30.00% Industry 4.00% 15.60% 32.0 days 8.00x 5.00x 2.50x 36.00% 9.40x 3.00x 30.00% Condition Poor Good Poor O.K. Profit Margin ROE DSO Inv. turnover F.A. turnover T.A. turnover Debt/ assets TIE Current ratio Payout ratio
4-11 Projected Financial Statements Step 1. Forecast next year s Income Statement to get Ret. Earn. Key Assumptions Sales are expected to increase by $500 million. (% S = 25%). Sales factor 1.25 Operated at full capacity last year Capacity factor 1.25 also Payables and accruals grow proportionally with sales. Dividend payout (30%) will be maintained. No new common stock will be issued. To finance AFN half notes and half long term debt will be used Interest rate = 8% for any debt. Use to increase fixed assets and fixed cost.
4-12 NWC: Projected Income Statement: Sales Less: VC FC EBIT Interest EBT Taxes (40%) Net. income Div. (30%) Add. to RE Last Yr. $2,000 1,200 700 $ 100 16 $ 84 34 $ 50 $ 15 $ 35 Factor Initial Forecast x1.25 x1.25 x1.25 $2,500 1,500 875 $ 125 16 $ 109 44 $ 65 $ 19 $ 46
4-13 Projected Financial Statements Step 2. Forecast the Balance Sheet Cash/sec. Accts. rec. Inventories Total CA Net FA Total assets $1,000 Last Yr $20 240 240 $500 500 Factor x1.25 x1.25 x1.25 x1.25 Initial Forecast $25 300 300 $625 625 $1,250 At full capacity, so all assets must increase in proportion to sales.
4-14 Projected Financial Statements Step 2. Forecast the 2001 Balance Sheet (Liability & Equity) AP/accruals Notes payable Total CL L-T debt Common stk. Ret. earnings Total liab./eq. 2000 $100 100 Factor Initial Forecast x1.25 $125 100 $200 100 500 200 $1,000 $225 100 500 246 $1,071 +46* *From projected income statement.
4-15 Projected Financial Statements Step 3. Raising the Additional Funds Needed Forecasted total assets Forecasted financing Forecast AFN1 = $1,250 $1,071 $ 179 = = NWC must have the assets to make forecasted sales. The balance sheet must balance. So, we must raise $179 externally.
4-16 How will the AFN be financed? Additional notes payable = 0.5 ($179) = $89.50 Additional L-T debt = 0.5 ($179) = $89.50 But this financing will add 0.08 ($179) = $14.32 to interest expense, which will reduce NI and retained earnings.
4-17 Projected Financial Statements Step 4. Financing Feedbacks The effects on the income statement and balance sheet of actions taken to finance forecasted increases in assets.
4-18 NWC: Revised Forecast of Income Statement 1st Pass Feedback $2,500 1,500 875 $125 16 $109 44 $65 $19 $46 2nd Pass Sales Less: VC FC EBIT Interest EBT Taxes (40%) Net. income Div. (30%) Add. to RE $2,500 1,500 875 $125 +14 30 $95 38 $57 $17 $40
4-19 NWC: Revised Forecast of Balance Sheet (Assets) Cash/sec. Accts. rec. Inventories Total CA Net FA Total assets 1st Pass Feedback 2nd Pass $25 300 300 $625 625 $1,250 $25 300 300 $625 625 $1,250 No change in asset requirements.
4-20 NWC: Feedback on the Forecast of the Balance Sheet (Liabilities & Equity) AP/accruals Notes payable Total CL L-T debt Common stk. Ret. earnings Total liab./eq. 1st Pass Feedback 2nd Pass $125 100 +89.5 $125 190 $225 100 500 246 $1,071 $315 189 500 240 $1,244 +89.5 -6 Look at a spreadsheet with all of this on one page.
4-21 Results of the Adjusted Forecast: Forecasted assets = $1,250 (no change) Forecasted claims = $1,244 (higher) 2nd pass AFN = $ 6 (short) Cumulative AFN = $179 + $6 = $185. The $6 shortfall came from reduced net earnings. Additional passes could be made until assets exactly equal liabilities/equity. ex: $6 (0.08) = $0.48 interest 3rd pass.
4-22 North West Chemical: Adjusted Key Ratios Profit Margin ROE DSO (days) Inv. turnover F.A. turnover T.A. turnover D/A ratio TIE Current ratio Payout ratio NWC Est. Next 2.27% 7.68% 43.2 5.00x 4.00x 2.00x 40.34% 4.12% 1.99x 30.00% Last Yr. 2.52% 7.20% 43.2 5.00x 4.00x 2.00x 30.00% 6.25x 2.50x 30.00% Industry 4.00% 15.60% 32.0 11.00x 5.00x 2.50x 36.00% 9.40x 3.00x 30.00% Poor O.K.
4-23 Analysis of the Forecast: How does North West Chemical Compare? Not very profitable relative to other companies in the industry. Carrying excess inventory and receivables. Debt ratio projected to move ahead of average. Overall, not in good shape and doesn t appear to be improving.
4-24 Other Considerations in Forecasting: Excess Capacity Suppose last year fixed assets had been operated at 90% of capacity: 1.25 x .90 = 1.125; will be at 112.5% of capacity Increase fixed assets and fixed cost by 12.5% (example in spreadsheet) Suppose last year fixed assets had been operated at only 75% of capacity: 1.25 x .75 = .9375; will be at 93.75% of capacity Would keep fixed assets and fixed cost the same as last year.
4-25 How would excess capacity affect the forecasted ratios? Sales wouldn t change but assets would be lower, so turnovers would be better. Less new debt, hence lower interest, so higher profits, EPS,ROE. Debt ratio, TIE would improve.
4-26 Forecasted Ratios: Profit Margin ROE DSO (days) Inv. turnover F.A. turnover T.A. turnover D/A ratio TIE Current ratio Payout ratio % of Capacity last year 100% 2.28% 7.70% 43.2 5.00x 4.00x 2.00x 40.8% 4.17% 1.96x 30.00% 90% 4.56% 14.6% 43.2 5.00x 4.44x 2.10x 34% 9.48x 2.35x 30.00% Industry 4.00% 15.60% 32.0 8.00x 5.00x 2.50x 36.00% 9.40x 3.00x 30.00%
4-27 Summary: How different factors affect the AFN forecast. Dividend payout ratio changes. If reduced, more RE, reduce AFN. Profit margin changes. If increases, total and retained earnings increase, reduce AFN. Plant capacity changes. Less capacity used, less need for AFN. AP Payment terms increased to 60 days from 30. Accts. payable would double, increasing liabilities, reduce AFN.