Financial Ratio Analysis and Profitability Ratios Overview
This unit focuses on financial ratio analysis, specifically profitability ratios like gross profit margin, designed to assess a business's financial performance based on its financial statements. By comparing information such as revenues, costs, assets, and liabilities, businesses can evaluate their profitability, efficiency, and financial health. Understanding these ratios is crucial for effective financial management and decision-making.

Download Presentation

Please find below an Image/Link to download the presentation.
The content on the website is provided AS IS for your information and personal use only. It may not be sold, licensed, or shared on other websites without obtaining consent from the author. Download presentation by click this link. If you encounter any issues during the download, it is possible that the publisher has removed the file from their server.
E N D
Presentation Transcript
Commercial Subjects Group Level 3 Subject Financial Mathematics 2 (Fin 316/806) Chapter Unit 5 Title Financial Ratio Analysis part 1 Second Semester 2024 - 2023 ) ( ) ( -
Learning Objectives Learning Objectives INITIATION ACTIVITY At this unit, our students will learn: INITIATION ACTIVITY The definition of the financial ratio. OBJECTIVE 1 OBJECTIVE 1 The calculation of and analyze profitability ratios. OBJECTIVE 2 OBJECTIVE 3 OBJECTIVE 3 50 % Like it! Like it! FINAL EVALUATION FIN 316/806 UNIT 5 Financial Ratio Analysis 2024 - 2023
INATIATION ACTIVITY INATIATION ACTIVITY INITIATION ACTIVITY What is the benefit of ratio analysis? INITIATION ACTIVITY Ratio analysis involves comparing information in the financial statements of a business to measure the performance. If a business is to survive and grow, it must make a profit and have enough cash to pay its bills. However, simply measuring how profit a business make each period and how much can it has doesn t tell us very much about financial strength or performance. Most businesses aim to make a profit and calculate their profit as the difference between their revenues and costs each period using an income statement. However, some businesses are able to generate more profit from their resources than others OBJECTIVE 1 OBJECTIVE 1 OBJECTIVE 2 OBJECTIVE 3 OBJECTIVE 3 FINAL EVALUATION FIN 316/806 UNIT 5 Financial Ratio Analysis 2024 - 2023
The calculation and analyze profitability ratios. 5 2 : Profitability Ratios INITIATION ACTIVITY INITIATION ACTIVITY 5-2-1: Gross Profit Margin % Fahad Ltd Statement of financial position BD million Fahad Ltd Income statements BD million End year End year 2 OBJECTIVE 1 OBJECTIVE 1 1 221 Non-current assets Cash Inventories Accounts Receivable Current assets less current liabilities Working capital Total assets current liabilities 295 Year 1 150 90 Years 2 10 20 14 44 40 30 15 5 50 25 Revenue less cost of sales Gross profit less Expenses 200 100 OBJECTIVE 2 60 15 100 20 4 25 OBJECTIVE 3 45 9 80 16 Profit before tax less tax Profit after tax Of which distributed profit retained profit 225 320 OBJECTIVE 3 36 64 Financed by Non-current liabilities Shareholders funds Capital employed 30 6 50 14 FINAL EVALUATION 150 75 120 200 225 320 FIN 316/806 UNIT 5 Financial Ratio Analysis 2024 - 2023
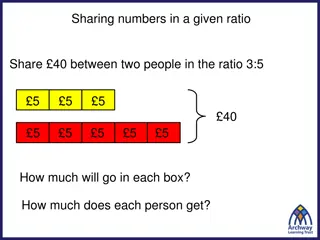
The calculation and analyze profitability ratios. 5 2 : Profitability Ratios INITIATION ACTIVITY Gross Profit Margin% INITIATION ACTIVITY 5-2-1: Gross Profit Margin % 50% 40% OBJECTIVE 1 OBJECTIVE 1 The gross profit margin is calculated as follows: YEAR 1 YEAR2 ????? ?????? ??????? 100 Gross profit margin (%) = OBJECTIVE 2 Year 2 Year 1 OBJECTIVE 3 OBJECTIVE 3 Gross profit (BD million) 60 150 100 = 40% 100 200 100 = 50% Revenue (BD million) 50 % FINAL EVALUATION Like it! Like it! FIN 316/806 UNIT 5 Financial Ratio Analysis 2024 - 2023
The calculation and analyze profitability ratios. 5 2 : Profitability Ratios INITIATION ACTIVITY INITIATION ACTIVITY 5-2-2: Profit Margin % OBJECTIVE 1 The profit margin is calculated as follows: OBJECTIVE 1 Profit margin (%) = ?????? ?????? ??? 100 ??????? OBJECTIVE 2 Year 1 Year 2 OBJECTIVE 3 OBJECTIVE 3 Profit before tax (million BD) Revenue (million BD) 80 200 100 = 40% 45 150 100 = 30% FINAL EVALUATION 40% Like it! Like it! FIN 316/806 UNIT 5 Financial Ratio Analysis 2024 - 2023
The calculation and analyze profitability ratios. 5 2 : Profitability Ratios INITIATION ACTIVITY INITIATION ACTIVITY 40% Like it! Like it! 5-2-2: Profit Margin % These profit margins are a very good outcome for the company. They show the following. After deducting overheads from gross profit the company was still able to generate profit before tax of 3BD from every 10BD of revenue in first year. This improved in year 2 is 4BD of profit before tax from every 10BD of revenue. This was because gross profit had increased by 40 million BD compared to an increase in overhead costs of just 5 million BD. The company had become more successful at controlling its overheads or fixed costs for example because it was making more efficient use employees office and electricity and/or had found cheaper suppliers of cleaning and maintenance services. The profit margin for main competitor in years 1 and 2 was 30%.This means that Fahad Ltd has become more profitable than its rival. OBJECTIVE 1 OBJECTIVE 1 OBJECTIVE 2 OBJECTIVE 3 OBJECTIVE 3 FINAL EVALUATION FIN 316/806 UNIT 5 Financial Ratio Analysis 2024 - 2023
The calculation and analyze profitability ratios. 5 2 : Profitability Ratios INITIATION ACTIVITY INITIATION ACTIVITY 5-2-3: Return on Capital Employed % (ROCE) The Return on capital employed is calculated as follows: OBJECTIVE 1 OBJECTIVE 1 ?????? ?????? ??? ??????? ???????? 100 ROCE (%) = Where Capital Employed = Non-current liabilities + Shareholders Funds OR OR = Total assets Current liabilities OBJECTIVE 2 OBJECTIVE 3 OBJECTIVE 3 Year 1 Year 2 Profit before tax (million BD) FINAL EVALUATION 80 320 100 = 25% 45 225 100 = 20% 25% Like it! Like it! Capital employed (million BD) FIN 316/806 UNIT 5 Financial Ratio Analysis 2024 - 2023
The calculation and analyze profitability ratios. 25% Like it! Like it! 5 2 : Profitability Ratios 5-2-3: Return on Capital Employed % (ROCE) INITIATION ACTIVITY INITIATION ACTIVITY ROCE recorded for Fahad Ltd gives the following information. The amount of profit returned from each BD10 of capital employed in the company was BD2 in year 1. By year 2 this had increased to BD2.5 of profit from every BD10 of capital employed in the company. These returns were much more than the owners could have earned from interest payments had they simply saved their capital in a bank savings account instead. At 25% ROCE of FahadLtd was also much higher than the 18% return earned by its main competitor over the same period, thereby making the resort a more attractive investment for its owners. The operating efficiency or productivity of the company had increased. Although capital employed had increased from BD 225 million to BD320 million it had become more successful at using assets to generate profit. For example, increasing in the scale of the company had allowed it to benefit from substantial economies of scale. OBJECTIVE 1 OBJECTIVE 1 OBJECTIVE 2 OBJECTIVE 3 OBJECTIVE 3 FINAL EVALUATION FIN 316/806 UNIT 5 Financial Ratio Analysis 2024 - 2023
EVALUATION MTA Wholesalesalers is a limited company operating in Bangladesh. It has been operating successfully for over 11 years. Below are some key results from its financial statements for the last two years. INITIATION ACTIVITY INITIATION ACTIVITY MTA wholesalers Pvt Ltd Summarized results from financial statements Year 10 BD (000) 400 240 ? 130 ? 200 Year 11 BD (000) 420 252 ? 147 ? 210 OBJECTIVE 1 Revenue Cost of sales Gross profit Overheads Profit for the year Capital employed OBJECTIVE 1 OBJECTIVE 2 Required: Required: OBJECTIVE 3 OBJECTIVE 3 From the information presented calculate each year the company s: Gross Profit %. FINAL EVALUATION Gross Profit Margin %. ROCE%. FIN 316/806 UNIT 5 Financial Ratio Analysis 2024 - 2023
EVALUATION Answer: MTA wholesalers Pvt Ltd Summarized results from financial statements ????? ?????? ??????? 100 INITIATION ACTIVITY Gross profit margin (%) = INITIATION ACTIVITY Year 1 = 140 400 100 = 35% Year 10 BD (000) Year 11 BD (000) Revenue 400 420 OBJECTIVE 1 Year 2 = 168 420 100 = 40% OBJECTIVE 1 - Cost of sales 240 252 = Gross profit 140 168 Profit margin (%) = ?????? ?????? ??? OBJECTIVE 2 100 -Overheads 130 147 ??????? Year 1 = 10 = Profit for the year 10 21 400 100 =2.5% OBJECTIVE 3 OBJECTIVE 3 Year 2 = 21 420 100 = 5% Capital employed 200 210 FINAL EVALUATION FIN 316/806 UNIT 5 Financial Ratio Analysis 2023 - 2022
EVALUATION Answer: INITIATION ACTIVITY INITIATION ACTIVITY MTA wholesalers Pvt Ltd Summarized results from financial statements ?????? ?????? ??? ??????? ???????? 100 ROCE (%) = OBJECTIVE 1 OBJECTIVE 1 Year 10 BD (000) Year 11 BD (000) Revenue 400 420 Year 1 = 10 200 100 = 5% OBJECTIVE 2 - Cost of sales 240 252 = Gross profit 140 168 Year 2 = 21 210 100 = 10% OBJECTIVE 3 - Overheads 130 147 OBJECTIVE 3 = Profit for the year 10 21 Capital employed 200 210 FINAL EVALUATION FIN 316/806 UNIT 5 Financial Ratio Analysis 2024 - 2023
END OF LESSON Thanks FIN 316/806 UNIT 5 Financial Ratio Analysis 2024 - 2023