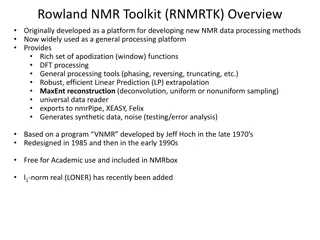
NMR Spectroscopy Data Analysis for Organic Compounds
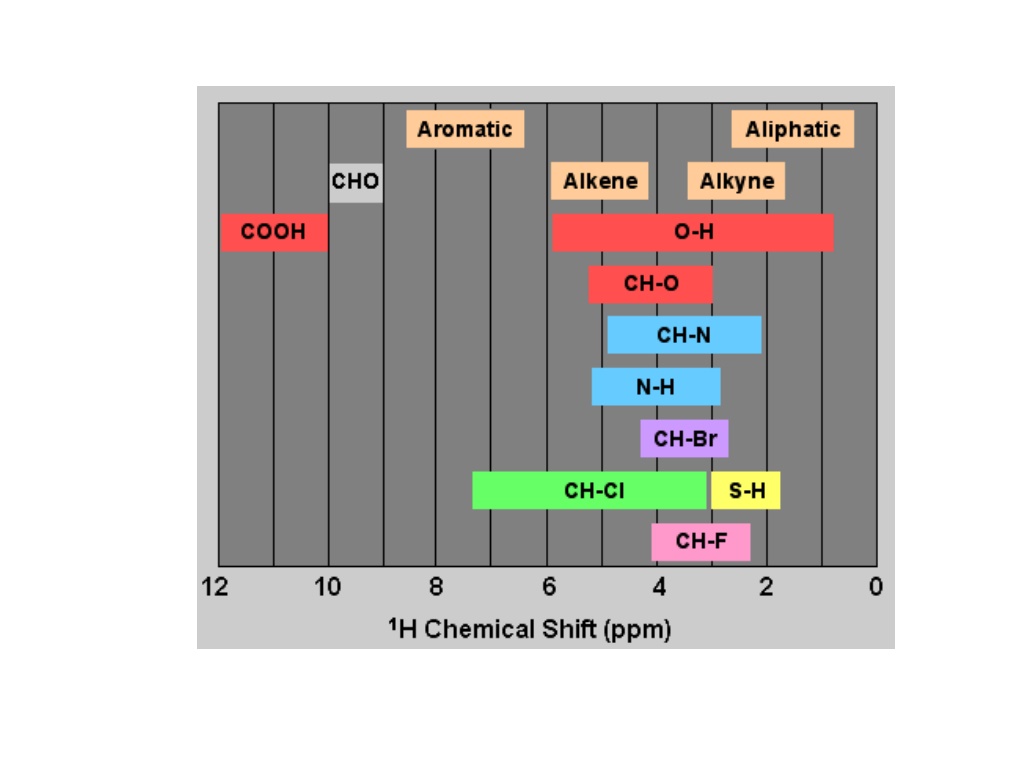
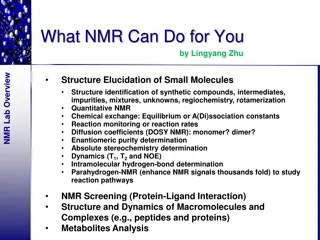
This dataset contains NMR spectroscopy data for various organic compounds, including their chemical shifts (ppm), peak areas, and molecular formulas. The information can be used for spectral analysis and identification of chemical structures.

Download Presentation

Please find below an Image/Link to download the presentation.
The content on the website is provided AS IS for your information and personal use only. It may not be sold, licensed, or shared on other websites without obtaining consent from the author. Download presentation by click this link. If you encounter any issues during the download, it is possible that the publisher has removed the file from their server.
E N D
Presentation Transcript
Shift (ppm)Area 9.78 7.75 6.90 3.77 1.00 2.02 2.01 3.17 (C8H8O2) s s d d
Shift (ppm) 4.13 2.02 1.15 Area 2.05 2.98 3.08 s t C4H8O2 q
C5H12O s Shift (ppm) 2.4 1.4 1.1 0.8 Area 1.00 2.03 5.98 3.01 q t
Shift (ppm)Area 3.19 0.89 1 1.00 4.65 C5H11Cl
C8H12O4 Shift (ppm) 6.05 4.01 1.08 Area 1.00 2.00 3.12 2 q t s
Shift (ppm) 180.8 33.8 26.8 22.4 3.58 Mult. S T T T Q C5H10O2 3
Shift (ppm) 202.5 43.5 31.8 29.3 29.2 22.6 22.1 14.1 C8H16O 4
C5H11Cl Shift (ppm) 57.3 33.1 27.3 5
Shift (ppm) 69.4 30.9 19.0 Mult. T D Q C5H10O 6
C2H3OBr3 Shift (ppm) 79.9 46.7 Mult. S T 7
C7H5OCl Shift (ppm) 191.0 141.1 134.8 131.0 129.4 8
Shift (ppm) Area C8H8O3 9.79 7.40 7.02 6.79 3.91 0.05 0.09 0.04 0.05 0.15 9
C8H8O3 Shift (ppm) 191.6 152.4 147.7 130.0 128.0 115.0 109.4 56.6 10
C7H6O2 Shift (ppm) 9.81 7.79 6.95 Area 1.00 1.90 1.96 11
C6H4NBr3 Shift (ppm) 141.3 133.7 108.7 12
Area")
Area")
")
")


Area")


")

")


")