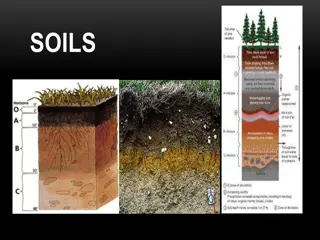
Mapping Soil Organic Carbon Fractions in Australia: Stocks and Uncertainty
This study by Mercedes Román Dobarco et al. focuses on mapping soil organic carbon fractions across Australia, including mineral-associated organic carbon, particulate organic carbon, and pyrogenic organic carbon. The research involves prediction of soil organic carbon fractions using spectral libraries, data cleaning techniques, and compositional data analysis. The study highlights the importance of understanding the different carbon fractions and their storage in Australian soils.

Download Presentation

Please find below an Image/Link to download the presentation.
The content on the website is provided AS IS for your information and personal use only. It may not be sold, licensed, or shared on other websites without obtaining consent from the author. Download presentation by click this link. If you encounter any issues during the download, it is possible that the publisher has removed the file from their server.
E N D
Presentation Transcript
Mapping soil organic carbon fractions for Australia, their stocks and uncertainty Mercedes Rom n Dobarcoa, , Alexandre M.J-C. Wadouxa, Brendan Maloneb, Budiman Minasnya, Alex B. McBratneya, Ross Searleb aSydney Instituteof Agriculture & School of Life and EnvironmentalSciences,The University of Sydney bCSIRO Agriculture and Food DSM CoP Workshop August 2022 DSM CoP Workshop 31st August 2022
Introduction Formation and properties of mineral-associated organic carbon (MAOC), particulate organic carbon (POC) and pyrogenic organic carbon (PyOC) SOC fraction MAOC POC PyOC partly decomposed plant litter and roots, fungal- derived LMW microbial origin, leachates from plant litter, rhizodeposition Charred residues. Condensed aromatic C Composition Protection mechanism Physico-chemical stabilization None or physical inaccessibility Biochemical recalcitrance Mean residence time Decades to centuries Decades to centuries Years to decades Figure modified after Jocelyn Lavallee https://www.nrel.colostate.edu/soil-carbon-is-a-valuable-resource-but-all-soil-carbon-is-not-created-equal/
Materials and Methods 1. Prediction of SOC fractions across the soil spectral libraries available for Australia Data cleaning Equal-area quadratic splines Aggregation (slab function of the aqp R package) isometric log-ratio (ilr) transformation Piecewise direct standardization PLSR (SCaRP) PLSR as compositional data (Vis-NIR and MIR) Spectral libraries harmonisation and prediction of SOC fractions Size and chemical fractionation 312 samples GlobalSoilMap depth standardization and transformation SCaRP Baldock et al., (2013)
Materials and Methods 1. Prediction of SOC fractions across the soil spectral libraries available for Australia Data cleaning Equal-area quadratic splines Aggregation (slab function of the aqp R package) isometric log-ratio (ilr) transformation Piecewise direct standardization PLSR (SCaRP) PLSR as compositional data (Vis-NIR and MIR) Spectral libraries harmonisation and prediction of SOC fractions Size and chemical fractionation 312 samples GlobalSoilMap depth standardization and transformation SCaRP
Materials and Methods 1. Prediction of SOC fractions across the soil spectral libraries available for Australia Data cleaning Equal-area quadratic splines Aggregation (slab function of the aqp R package) isometric log-ratio (ilr) transformation Piecewise direct standardization PLSR (SCaRP) PLSR as compositional data (Vis-NIR and MIR) Spectral libraries harmonisation and prediction of SOC fractions GlobalSoilMap depth standardization and transformation Size and chemical fractionation 312 samples SCaRP
Materials and Methods 2. Digital soil mapping of the proportions of SOC fractions, coarse fragments, SOC fraction density and uncertainties 500 simulations Conditional probability distribution ilr1, ilr2, TOC CF: Sample proportional to class probability Ilr1 and ilr2 QRF 500 samples and back-transformed 5thand 95th 10-fold cross- validation Classes (% volume) GSM depths 110,308 locations Probability random forests 10-fold cross- validation SOC fractions (% SOC) TOC content Bulk density Coarse fragments Uncertainty SOC fraction density SOC Coarse fragments SOC fraction stocks fractions
Materials and Methods 2. Digital soil mapping of the proportions of SOC fractions, coarse fragments, SOC fraction density and uncertainties 500 simulations Conditional probability distribution ilr1, ilr2, TOC CF: Sample proportional to class probability Ilr1 and ilr2 QRF 500 samples and back-transformed 5thand 95th 10-fold cross- validation Classes (% volume) GSM depths 110,308 locations Probability random forests 10-fold cross- validation SOC fractions (% SOC) TOC content Bulk density Coarse fragments Uncertainty SOC fraction density SOC Coarse fragments SOC fraction stocks fractions
Results - SOC fractions Cross-validation statistics for ilr-transformed variables and back-transformed variables SOC fraction Depth 0-5 cm 5-15 cm 15-30 cm 0-5 cm 5-15 cm 15-30 cm Depth 0-5 cm 5-15 cm 15-30 cm 0-5 cm 5-15 cm 15-30 cm 0-5 cm 5-15 cm 15-30 cm ME -0.01 -0.01 -0.01 0.01 0.01 0.00 ME (%) 1.18 1.27 2.00 -0.88 -0.83 -1.24 -0.31 -0.46 -0.77 RMSE 0.45 0.42 0.56 0.46 0.47 0.58 RMSE (%) 8.42 8.84 10.35 6.58 6.20 7.06 7.72 7.92 8.78 r2 R2 0.60 0.63 0.54 0.73 0.74 0.68 R2 0.74 0.73 0.68 0.67 0.65 0.59 0.80 0.79 0.76 CCC 0.75 0.77 0.70 0.84 0.85 0.81 CCC 0.85 0.85 0.82 0.80 0.79 0.74 0.89 0.89 0.87 0.60 0.63 0.54 0.73 0.74 0.68 r2 0.75 0.74 0.69 0.67 0.66 0.60 0.80 0.79 0.76 ilr1 ilr2 SOC fraction MAOC POC PyOC
Variable importance (permutation) RandomForest models Parent material and clay more important for the ilr1 models Non-photosynthetic vegetation and mean EVI most important vegetation covariates 3 Climate covariates more important for the Climate covariates more important for the ilr2 models ilr2 models Elevation, slope, roughness and TWI most important relief covariates
Contribution of SOC fractions to total SOC (% SOC) RGB map 0 - 5 cm 15 - 30 cm 5 - 15 cm Coarse-textured soils with lower capacity for physico- chemical protection and greater proportion of POC may be more vulnerable to SOC loss with an increase in temperature.
SOC fraction stocks (0-30 cm) log10 (Mg C ha-1) 12.7 Pg MAOC 64 % total SOC 2 Pg POC 10 % total SOC 5.1 Pg PyOC 26 % total SOC
SOC fraction stocks (0-30 cm) by biome and land cover Mg C ha-1
Global sensitivity analysis Total Sobol indices for SOC fractions density (Mg C ha-1 cm) Depth 0-5 cm. High value Factor important contributor to the variance of the output. ST close to 0 the factor is non- influential on the uncertainty TOC and the distribution among fractions were the most influential variables on SOC fraction density uncertainty.
Summary We combined spectroscopy with digital soil mapping for mapping SOC fractions in the 0-30 cm. Climate and parent material were the most important soil-forming factors predicting the allocation of SOC among fractions. The SOC stocks (0-30 cm) were estimated as 12.7 Pg MAOC-C, 2 Pg POC-C and 5.1 Pg PyOC-C. TOC and the distribution among fractions were the most influential variables on SOC fraction uncertainty. These maps can be used as input for modelling SOC stocks under different management strategies and identify areas where SOC stocks could be augmented more efficiently.
Soil C Fractions Resistant OC carbon From Lavallee (2020)
Uncertainty evaluation


 – RandomForest models")
")
 – RGB")
")
 by biome and land cover")