Analysis of Variance in Completely Randomized Design
This content covers the analysis of variance in a completely randomized design, focusing on comparing more than two groups with numeric responses. It explains the statistical methods used to compare groups in controlled experiments and observational studies. The content includes information on 1-way ANOVA for normal data, sums of squares, degrees of freedom, and the F-test. It also provides details on the statistical model, mean squares, and assumptions in the analysis of variance.
Download Presentation

Please find below an Image/Link to download the presentation.
The content on the website is provided AS IS for your information and personal use only. It may not be sold, licensed, or shared on other websites without obtaining consent from the author. Download presentation by click this link. If you encounter any issues during the download, it is possible that the publisher has removed the file from their server.
E N D
Presentation Transcript
Section 7.1 1-Way Analysis of Variance - Completely Randomized Design
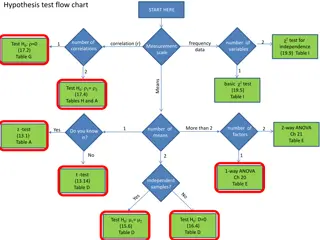
Comparing k > 2 Groups - Numeric Responses Extension of Methods used to Compare 2 Groups Independent Samples and Paired Data Designs Normal and non-normal data distributions Data Design Normal Non- normal Independent Samples (CRD) Paired Data (RBD) F-Test 1-Way ANOVA F-Test 2-Way ANOVA Kruskal- Wallis Test Friedman s Test
Completely Randomized Design (CRD) Controlled Experiments - Subjects assigned at random to one of the k treatments to be compared Observational Studies - Subjects are sampled from k existing groups Statistical model Yijis the random measurement from the jthunit (or subject) from group i: = + + = + Y ij i ij i ij where is the overall mean, i is the effect of treatment i , ij is a random error, and i is the population mean for group i
1-Way ANOVA for Normal Data (CRD) Once samples are obtained, for each group obtain the mean, standard deviation, and sample size: 2 ( ) y y y ij ij i j j = = = 1,..., y s i k i i 1 n n i i Obtain the overall mean and sample size = y + + ... n n y n y ij i j = + + = 1 ... 1 k k n n n y 1 k n
Analysis of Variance - Sums of Squares Total Variation in ( ) k 2 = = 1 TSS y y df n ij Total = = 1 1 i j Between Group (Treatment) Variation in ( ) ( ) k k 2 2 = = = 1 SST y y n y y df k i T i i = = = 1 1 1 i j i Within Group (Error) Variation ( 1 1 i j = = in ) k k 2 ( ) = = = 2 i 1 SSE y y n s df n k ij i E i = 1 i = + = + TSS SST SSE df df df Total T E
Analysis of Variance Table and F-Test Source of Variation Treatments Error Total Assumption: All distributions normal with common variance Degrees of Freedom k-1 n -k n -1 Sum of Squares SST SSE TSS Mean Square MST=SST / (k-1) MSE=SSE / ( n -k) F F=MST/MSE H0: No differences among Group Means ( = = k=0) HA: Group means are not all equal (Not all i are 0) SST k SSE n MST MSE 1 = = . .: T S F obs k P = . .: R R F ( ) F P F F , 1, 1, obs k n k k n k obs
Expected Mean Squares Model: Yij= + i+ ij with ij~ N(0, 2), ni i= 0: k i 2 i n = = + 2 2 = 1 k i E MSE E MST 1 k i 2 i n k i 2 i n + 2 = 1 k i E MST E MSE 1 = = + = 1 1 i ( ) 2 2 1 k E MST E MSE = = = = When : 0 is true, 1 H 0 1 k E MST E MSE otherwise ( is true), 1 H A
Expected Mean Squares 3 Factors effect magnitude of F-statistic (for fixed k) True group effects ( 1, , ) Group sample sizes (n1, ,nk) Within group variance ( 2) Fobs = MST/MSE When H0 is true ( 1= = =0), E{MST}/E{MSE}=1 Marginal Effects of each factor (all other factors fixed) As spread in ( 1, , k) E{MST}/E{MSE} As (n1, ,nk) E{MST}/E{MSE} (when H0 false) As 2 E{MST}/E{MSE} (when H0 false)
0.09 0.09 0.08 0.08 0.07 0.07 0.06 0.06 0.05 0.05 0.04 0.04 E MST E MSE 0.03 0.03 0.02 0.02 0.01 0.01 0 0 0 20 40 60 80 100 120 140 160 180 200 0 20 40 60 80 100 120 140 160 180 200 A) =100, 1=-20, 2=0, 3=20, = 20 B) =100, 1=-20, 2=0, 3=20, = 5 n 4 8 12 20 A 9 17 25 41 B C 1.5 2 2.5 3.5 D 9 17 25 41 129 257 385 641 0.09 0.08 0.09 0.07 0.08 0.06 0.07 0.05 0.06 0.04 0.05 0.03 0.04 0.02 0.03 0.01 0.02 0 0.01 0 20 40 60 80 100 120 140 160 180 0 0 20 40 60 80 100 120 140 160 180 200 C) =100, 1=-5, 2=0, 3=5, = 20 D) =100, 1=-5, 2=0, 3=5, = 5
Example Virtual Training of Lifeboat Task Treatments - k = 4 Methods of Virtual Training Traditional Lecture and Materials (LEC/MAT) Computer Monitor / Keyboard (MON/KEY) Head Mounted Display / Joypad (HMD/JPD) Head Mounted Display / Wearable Sensors (HMD/WEA) Response (Y) Procedural Knowledge Test Score n = 16 subjects per treatment (Data generated to match) Trt 1 2 3 4 Label LEC/MAT MON/KEY HMD/JOY HMD/WEA n 16 16 16 16 Mean 4.931 7.708 6.736 6.875 SD 1.94 1.43 2.82 1.99 Source: J. Jung and Y.J. Ahn (2018). Effects of Interface on Procedural Skill Transfer in Virtual Training: Lifeboat Launching Operation Study, Computer Animation & Virtual Worlds, 29, e1812. https://doi.org/10.1002/cav.1812
Procedural Knowledge Scores - Data/Means Data generated to match group means and standard deviations
Procedural Knowledge Scores Sums of Squares Trt 1 2 3 4 All Label LEC/MAT MON/KEY HMD/JOY HMD/WEA n 16 16 16 16 64 Mean 4.931 7.708 6.736 6.875 6.5625 SD 1.94 1.43 2.82 1.99 = = = Between Treatments: 1 4 1 3 df k T ( ) k 2 = = SST n y y i i = 1 i ( ) ( ) ( ) ( ) 2 2 2 2 = 4.931 6.5625 + 7.708 6.5625 + 6.736 6.5625 + 6.875 6.5625 = 16 65.6639 = = 64 4 = Within Treatments: 60 df n k E n ( ) k k 2 i ( ) 16 ( ) 1 1.94 = = = + + + = 2 2 2 2 2 1 1.43 2.82 1.99 265.8149 SSE y y n s ij i i i = = = 1 1 1 i df j i = = = Total: 1 64 1 63 n Total in ( ) k 2 = = + = 65.6639 265.8149 + = 331.4788 TSS y y SST SSE ij = = 1 1 i j
Procedural Knowledge Scores ANOVA Source Treatments Error Total df SS MS F_obs F(.05) P(>F) 3 65.6639 21.888 4.4302 4.9406 2.7581 0.0039 60 265.8149 63 331.4788 ( ) = = = : No differences among population means No differences among true mean procedural knowledge scores among the 4 methods ... 0 H 0 1 4 = : Differences exist among population means (Not all Differences exist among true mean procedural knowledge scores among the 4 methods 0) H A i ( ) ( ) = = = Reject the null hypothesis 4.941; 2.758; 4.941 0.0039 F .05,3,60 F the 4 training methods P F 3,60 obs Evidence of differences among effects of
R Commands with aov Function vt <- read.csv("http://users.stat.ufl.edu/~winner/data/virtual_training.csv") attach(vt); names(vt) grp.trt <- factor(grp.trt, levels=1:4, labels=c("LEC/MAT","MON/KEY","HMD/JOY","HMD/WEA")) vt.mod1 <- aov(procKnow ~ grp.trt) anova(vt.mod1) > anova(vt.mod1) Analysis of Variance Table Response: procKnow Df Sum Sq Mean Sq F value Pr(>F) grp.trt 3 65.664 21.8880 4.9406 0.003931 ** Residuals 60 265.815 4.4302
Transformations for Constant Variance ( ) = = = + = 2 or 0.375 Used for Poisson Distribution 1 k y y y y k T T ( ) y ( ) = = = + 2 2 ln or ln 1 k y y y T T ( ) 1 n ^ ( ) = = = = 2 1 1 sin Used for Binomial Distrbution , k y y k y T Box-Cox Transformation: Power Transf and often constant variance for strictly positive responses = ormation used to obtain normality ( ) y n 1/ n ln n n 1 y i = = = 0 exp 1 i y y ( ) i 1 = y 1 i y T ( ) y = ln 0
Power Approach to Sample Size Choice R Code When the means are not all equal, the -statistic is non-central : F F k i 2 i n MST MSE = = = 1 ~ where i F F 1, , k n k 2 k 2 i n = = 1 When all sample sizes are equal: i at the significance level of : 2 The power of the test, when conducted ; 1, Pr | In R: (1 , k n k F qf = ~ F F F F 1, , k n k k n k = 1, ) k n k 1, , ( ) Power = 1 1 (1 , 1, ), 1, , pf qf k n k k n k
Power Example Scenarios on Slide 9 = = = = = = = = = = = = = = = = = = = = = = = + + Scenario A: Scenario B: Scenario C: Scenario D: 100 100 100 100 20 20 5 5 0 0 20 20 20 5 1 2 3 1 = 2 3 4 4 + 1 2 = = 3 = = 1 = = 2 3 + 0 0 5 5 20 5 0.25 0.25 1 2 3 1 2 3 = = 1 2 3 1 2 3 k 2 i n = = = Note that A and D are equivalent (also see slide 9) 4,8,12,20 1 i n 2 > round(power.out,3) lambda.A power.A lambda.B power.B lambda.C power.C n=4 8 0.560 128 1 0.5 0.078 n=8 16 0.924 256 1 1.0 0.121 n=12 24 0.991 384 1 1.5 0.166 n=20 40 1.000 640 1 2.5 0.261
Linear Contrasts Linear functions of the treatment means (population and sample) such that the coefficients sum to 0. Used to compare groups or pairs of treatment means, based on research question(s) of interest k k = + + = where = Population Contrast: ... 0 C a a a a 1 1 k k i i i = = 1 1 i i k ^ = + + = Contrast Estimator: ... C a Y a Y a Y 1 k i 1 k i = 1 i 2 i 2 i 2 2 a n a n k k ^ ^ ^ = + + = = 2 1 2 k 2 ... V C a a V C MSE n n = = 1 1 i i 1 k i i k M SE n ^ ^ = = = = = 2 i ... n n n V C a 1 k 1 i
Example Virtual Training of Lifeboat Task Treatments - k = 4 Methods of Virtual Training (n=16) 1: Traditional Lecture and Materials (LEC/MAT) 2: Computer Monitor / Keyboard (MON/KEY) 3: Head Mounted Display / Joypad (HMD/JPD) 4: Head Mounted Display / Wearable Sensors (HMD/WEA) Consider 3 Contrasts: C1: 1 vs (2,3,4): Traditional versus Computer/HMD C1: a1 = 3, a2 = a3 = a4 = -1 C2: 2 vs (3,4): Computer versus HMD C2: b1 = 0, b2 = 2, b3 = b4 = -1 C3: 3 vs 4: HMD/JPD vs HMD/WEA C3: d1 = d2 = 0, d3 = 1, d4 = -1
Orthogonal Contrasts & Sums of Squares k k k k = = = = Two Contrasts: 0 C a C b a b 1 2 i i i i i i = = = = 1 1 1 1 i i i i ab k k = = , are orthogonal if: 0 for balanced data, 0 i i n C C ab 1 2 i i = = 1 1 i i i 2 2 2 k k ^ ^ a Y C n C i i = = = = 1 i Contrast Sum of Squares: for balanced data, SSC SSC 2 i 2 i k k a n a n 2 i a = 1 = = i 1 1 i i i i Among treatments, we can obtain Then, we can decompose the Between Treatment Sum of Squares into the ... where each of the Contrast Sums of Squares has 1 degree of freedom k SST SSC SSC = + + 1 pairwise orthogonal Contrasts: ,..., k k C C 1 Contrasts: 1 k 1 1
Tests and Confidence Intervals for Contrasts k k ^ = + + = Estimator: = + + = ... ... C a a a C a Y a Y a Y 1 k i 1 1 1 k k i i k i = = 1 1 i i 2 i a n k k MSE n ^ ^ ^ ^ ^ ^ ^ ^ = = = = = = 2 i ... V C MSE n n n V C a SE C V C 1 k = = 1 1 i i i k ^ c t ^ ^ ^ c ( ) = 1 100% CI for : where based on obs erved Trt Means C SE C a y /2, n k i i = 1 i ^ c ( ) = = = test for : 0 : 0 : : 2 t H C H C TS t RR t t P P t t 0 /2, A C C n k n k C ^ ^ SE C 2 2 2 k ^ c ^ a y n c i i = = = = 1 i Contrast Sum of Squares: for balanced data, SSC SSC 2 i 2 i k k k a n a n 2 i a = 1 = = i 1 1 i i SSC MSE i i = = test for : 0 : 0 : : F H C H C TS F RR F F 0 ,1, A C C n k
Example Virtual Training of Lifeboat Task Trt (i) 1 2 3 4 Sum Label LEC/MAT MON/KEY HMD/JOY HMD/WEA n_i 16 16 16 16 64 ybar_i 4.931 7.708 6.736 6.875 a_i 3 -1 -1 -1 0 b_i 0 2 -1 -1 0 d_i 0 0 1 -1 0 c1 c2 0 c3 0 0 a_i^2/n_i b_i^2/n_i d_i^2/n_i 0.5625 0 0.0625 0.25 0.0625 0.0625 0.0625 0.0625 0.75 0.375 14.793 -7.708 -6.736 -6.875 -6.526 0 0 15.416 -6.736 -6.875 1.805 6.736 -6.875 -0.139 0.0625 0.0625 0.125 = = 64 4 = = 4.430 60 2.000 MSE n k .025,60 t ^ c = = Contrast 1: 3 6.526 y y y y 1 1 2 3 4 2 i a n ^ ^ ( ) = = = 4.430 0.750 1.823 SE C MSE 1 i ( ) ( ) 6.526 2.000 1.823 6.526 3.646 = 95% CI: 10.172, 2.880 6.526 1.823 = = 3.580 test: : 0 : 0 : t H C H C TS t 0 1 1 1 A C ( ) = = 2 3.580 .0007 P P t 60
Example Virtual Training of Lifeboat Task Trt (i) 1 2 3 4 Sum Label LEC/MAT MON/KEY HMD/JOY HMD/WEA n_i 16 16 16 16 64 ybar_i 4.931 7.708 6.736 6.875 a_i 3 -1 -1 -1 0 b_i 0 2 -1 -1 0 d_i 0 0 1 -1 0 c1 c2 0 c3 0 0 a_i^2/n_i b_i^2/n_i d_i^2/n_i 0.5625 0 0.0625 0.25 0.0625 0.0625 0.0625 0.0625 0.75 0.375 14.793 -7.708 -6.736 -6.875 -6.526 0 0 15.416 -6.736 -6.875 1.805 6.736 -6.875 -0.139 0.0625 0.0625 0.125 2 ^ c ( ) 2 1 6.526 0.750 = = = 56.785 SSC 1 2 i a n i 56.785 4.430 = = = test: : 0 : 0 : 12.818 F H C H C TS F 0 1 1 1 A C = = : 4.001 .0007 RR F .05,1,60 F P 1 C Note that these are orthogonal contrasts: 3(0) ( 1)(2) i i ab = + ( ) 2 8.688 0.375 SSC SSC SSC + + = ( 1)( 1) + ( 1)( 1) + ( 0.139 0.125 (up to rounding) SST = = = 0 a d bd i i i i ) 2 2 1.805 = = = = 0.155 SSC SSC 3 = 65.628 1 2 3
Simultaneous Tests of Multiple Contrasts Using m contrasts for comparisons among k treatments Each contrast to be tested at significance level, which we label as I for individual comparison Type I error rate Probability of making at least one false rejection of one of the m null hypotheses is the experimentwise Type I error rate, which we label as E Tests are not independent unless the error (Within Group) degrees of freedom are infinite, however Bonferroni inequality implies that E m I Choose I = E / m
Scheffes Method for All Contrasts Can be used for any number of contrasts, even those suggested by data. Conservative (Wide CI s, Low Power) k k = = . . 0 C a st a i i i = = 1 1 i i 2 i a n k k ^ c ^ ^ = = a y SE C MSE i i = = 1 1 i i i k k = = = : 0 : 0 H C a H C a 0 i i A i i = = 1 1 i i ^ c ^ ^ ( ) = = = Reject if 1 1, H SE C k F df k df df n k 0 , , 1 2 E df df 1 2 E ^ c SE C ^ ^ ( ) ( ) Simultaneous 1 100% Confidence Intervals: 1 k Edf df F , , E 1 2
Post-hoc Comparisons of Treatments Often researchers want to compare pairs of groups. Three popular methods include (out of many): Dunnett s Method: Used for simultaneous comparisons of k-1 treatment groups with a control group. Simultaneous Tests and CI s Bonferroni s Method - Adjusts individual comparison error rates so that all conclusions will be correct at desired confidence/significance level. Very general approach can be applied to many multiple inferential problems. Simultaneous Tests and CI s Tukey s Method - Specifically compares all k(k-1)/2 pairs of groups. Tests and CI s
Dunnetts Method to Compare Trts to Control Want to compare k-1 active treatments with a control condition simultaneously Based on equal sample sizes of n subjects per treatment Makes use of Dunnett s d-table, indexed by the number of comparisons, error degrees of freedom, = n k, E, and whether the individual tests are 1-sided or 2-sided 2 MSE n = = = = : D d df n k H , 1, 0 Ek E i i c ( ) : Reject if 2-Sided CI: H H y y 2-sided D y y 2-sided D 0 Ai i c i i c i c ( ) : Reject if Upper 1-Sided CI: , H H y y 1-sided D y y ( 1-sided D ) c y 0 Ai i c i i c i c + : Reject if Lower 1-Sided CI: , H H y y 1-sided D y 1-sided D 0 Ai i c i i c i
Dunnett Critical Values 2-Sided E = 0.05 2-Sided (0.05)- Dunnett df\(k-1) 5 6 7 8 9 10 11 12 13 14 15 16 17 18 19 20 25 30 35 40 45 50 55 60 70 90 110 130 150 1000 10000 2 3 4 5 6 7 8 9 3.031 2.863 2.752 2.673 2.614 2.569 2.532 2.503 2.478 2.457 2.439 2.424 2.411 2.399 2.388 2.379 2.344 2.321 2.305 2.293 2.284 2.276 2.270 2.265 2.258 2.247 2.241 2.237 2.233 2.215 2.211 3.293 3.100 2.971 2.880 2.812 2.759 2.717 2.683 2.655 2.631 2.610 2.593 2.577 2.563 2.551 2.541 2.500 2.474 2.455 2.442 2.431 2.423 2.416 2.410 2.401 2.389 2.382 2.377 2.373 2.353 2.348 3.476 3.264 3.123 3.023 2.948 2.891 2.845 2.807 2.776 2.750 2.728 2.708 2.691 2.676 2.663 2.651 2.607 2.578 2.558 2.543 2.531 2.522 2.515 2.508 2.499 2.486 2.478 2.472 2.468 2.446 2.441 3.615 3.389 3.238 3.132 3.052 2.991 2.941 2.901 2.868 2.840 2.816 2.796 2.778 2.762 2.747 2.735 2.688 2.657 2.635 2.619 2.607 2.597 2.589 2.583 2.572 2.558 2.550 2.544 2.539 2.515 2.51 3.727 3.489 3.331 3.219 3.135 3.071 3.019 2.977 2.942 2.913 2.887 2.866 2.847 2.830 2.815 2.802 2.752 2.720 2.697 2.680 2.667 2.657 2.649 2.642 2.631 2.616 2.607 2.601 2.596 2.571 2.566 3.821 3.573 3.409 3.292 3.205 3.137 3.084 3.040 3.004 2.973 2.947 2.924 2.904 2.887 2.871 2.857 2.806 2.772 2.749 2.731 2.717 2.707 2.698 2.691 2.679 2.664 2.655 2.648 2.643 2.617 2.612 3.901 3.645 3.475 3.354 3.264 3.195 3.139 3.094 3.056 3.024 2.997 2.974 2.953 2.935 2.919 2.905 2.852 2.817 2.792 2.774 2.760 2.749 2.740 2.732 2.721 2.705 2.695 2.688 2.684 2.656 2.651 3.970 3.707 3.533 3.409 3.316 3.244 3.187 3.141 3.102 3.069 3.041 3.017 2.996 2.978 2.961 2.946 2.891 2.856 2.830 2.812 2.797 2.786 2.777 2.769 2.757 2.741 2.731 2.724 2.718 2.690 2.685
Dunnett Critical Values 1-Sided E = 0.05 1-sided (0.05) - Dunnett df\(k-1) 5 6 7 8 9 10 11 12 13 14 15 16 17 18 19 20 25 30 35 40 45 50 55 60 70 90 110 130 150 1000 10000 2 3 4 5 6 7 8 9 2.441 2.337 2.267 2.217 2.180 2.151 2.127 2.108 2.092 2.079 2.067 2.057 2.048 2.040 2.034 2.027 2.004 1.989 1.978 1.970 1.964 1.959 1.955 1.952 1.947 1.940 1.936 1.933 1.930 1.918 1.915 2.682 2.558 2.476 2.417 2.372 2.338 2.310 2.287 2.269 2.253 2.239 2.227 2.217 2.208 2.200 2.192 2.165 2.147 2.135 2.125 2.118 2.112 2.108 2.104 2.098 2.090 2.085 2.081 2.079 2.064 2.061 2.849 2.711 2.619 2.553 2.504 2.466 2.435 2.410 2.389 2.371 2.356 2.343 2.332 2.321 2.312 2.304 2.274 2.255 2.241 2.230 2.222 2.216 2.211 2.206 2.200 2.191 2.185 2.181 2.178 2.163 2.159 2.976 2.827 2.728 2.657 2.604 2.562 2.529 2.502 2.480 2.461 2.444 2.430 2.418 2.407 2.397 2.389 2.356 2.335 2.320 2.309 2.300 2.294 2.288 2.283 2.276 2.267 2.261 2.256 2.253 2.237 2.232 3.078 2.920 2.815 2.740 2.684 2.640 2.605 2.576 2.552 2.532 2.515 2.500 2.487 2.475 2.465 2.456 2.422 2.399 2.383 2.372 2.363 2.355 2.349 2.345 2.337 2.327 2.320 2.316 2.313 2.295 2.291 3.163 2.998 2.888 2.809 2.750 2.704 2.668 2.638 2.613 2.592 2.574 2.558 2.544 2.532 2.521 2.512 2.476 2.452 2.436 2.424 2.414 2.407 2.400 2.395 2.387 2.377 2.370 2.365 2.362 2.343 2.339 3.236 3.064 2.950 2.868 2.807 2.759 2.721 2.690 2.664 2.642 2.623 2.607 2.593 2.580 2.569 2.559 2.522 2.498 2.481 2.468 2.458 2.450 2.444 2.438 2.430 2.419 2.412 2.407 2.404 2.385 2.380 3.300 3.122 3.004 2.919 2.856 2.807 2.768 2.736 2.709 2.686 2.667 2.650 2.635 2.622 2.611 2.601 2.562 2.537 2.519 2.506 2.496 2.488 2.481 2.476 2.467 2.456 2.449 2.444 2.440 2.420 2.416
Example Virtual Training of Lifeboat Task Treat the Traditional Lecture/Materials condition as the Control Comparing with each of the k-1 = 3 computer-based conditions Will compute 1-sided and 2-sided critical values for Tests and Confidence Intervals, however, a priori, 2-sided seems more appropriate: the computer could be distracting with lower scores = = = = = 4.430 64 4 60 2-sided: 2.410 1-sided: 2.104 MSE n k d d 0.05,3,60 0.05,3,60 2 ( ) ( ) = = = = = 2.410 4.430 2.410 0.744 1.793 2.104 0.744 1.565 2-sided D 1-sided D 16 = = = = = 4.931 7.708 = 6.736 6.875 y y y y y 1 2 3 4 c ( ) = Trt 2 vs Control: 7.708 4.931 2.777 2-Sided CI: 2.777 1.793 0.984, 4.570 y y 2 c ( ( ) ) = 4.931 1.805 2-Sided CI: 1.805 1.793 = Trt 3 vs Control: 6.736 0.012,3.598 y y 3 c = 6.875 4.931 1.944 2-Sided CI: 1.9 = 44 1.793 Trt 4 vs Control: 0.151,3.737 y y 4 c All active treatments are significantly different from Control (their means differ by more than 1.793, CI s do not contain 0)
Bonferronis Method (Most General) Wish to make c comparisons of pairs of groups with simultaneous confidence intervals or 2-sided tests When all pair of treatments are to be compared, c = k(k-1)/2 Want the overall confidence level for all intervals to be correct to be 95% or the overall type I error rate for all tests to be 0.05 For confidence intervals, construct (1-(0.05/c))100% CIs for the difference in each pair of group means (wider than 95% CIs) Conduct each test at =0.05/c significance level (rejection region cut-offs more extreme than when =0.05) Critical t-values are given in table on class website, we will use notation: t /2,c, where c=#Comparisons, = dfError
Bonferronis Method (Most General) When making all possible comparisons among k treatments, there are c = k(k-1)/2 pairs. Set each individual comparison at I = E / c error rate Can be generalized to any # of comparisons 1 n 1 n = + B t MSE /2, , ' ii c v ' i i given on "Bonferroni t-table" t /2, , c v ( ) 1 k k = = with number of comparisons and c v n -k 2 Conclude if y y B ' ' ' i i ii i i ( ) Bonferroni's Simultaneous Confidence Intervals : y y B ' ' ii i i
Bonferroni Critical Values 2-Sided E = 0.05 2-sided (0.05) - Bonferroni df\C 5 3.534 6 3.287 7 3.128 8 3.016 9 2.933 10 2.870 11 2.820 12 2.779 13 2.746 14 2.718 15 2.694 16 2.673 17 2.655 18 2.639 19 2.625 20 2.613 25 2.566 30 2.536 35 2.515 40 2.499 45 2.487 50 2.477 55 2.469 60 2.463 70 2.453 90 2.440 110 2.431 130 2.425 150 2.421 1000 2.398 10000 2.394 3 6 10 15 21 28 36 45 4.219 3.863 3.636 3.479 3.364 3.277 3.208 3.153 3.107 3.069 3.036 3.008 2.984 2.963 2.944 2.927 2.865 2.825 2.797 2.776 2.760 2.747 2.737 2.729 2.715 2.698 2.687 2.679 2.674 2.644 2.639 4.773 4.317 4.029 3.833 3.690 3.581 3.497 3.428 3.372 3.326 3.286 3.252 3.222 3.197 3.174 3.153 3.078 3.030 2.996 2.971 2.952 2.937 2.925 2.915 2.899 2.878 2.865 2.856 2.849 2.813 2.808 5.247 4.698 4.355 4.122 3.954 3.827 3.728 3.649 3.584 3.530 3.484 3.444 3.410 3.380 3.354 3.331 3.244 3.189 3.150 3.122 3.100 3.083 3.069 3.057 3.039 3.016 3.001 2.990 2.983 2.942 2.936 5.666 5.030 4.636 4.370 4.179 4.035 3.923 3.833 3.760 3.699 3.648 3.604 3.565 3.532 3.503 3.477 3.380 3.319 3.276 3.244 3.220 3.201 3.186 3.173 3.153 3.127 3.110 3.099 3.091 3.046 3.039 6.045 5.326 4.884 4.587 4.374 4.215 4.091 3.992 3.912 3.845 3.788 3.740 3.698 3.661 3.629 3.601 3.495 3.428 3.382 3.347 3.321 3.300 3.284 3.270 3.248 3.220 3.202 3.190 3.181 3.132 3.125 6.391 5.594 5.107 4.781 4.549 4.375 4.240 4.133 4.045 3.973 3.911 3.859 3.814 3.774 3.739 3.709 3.595 3.523 3.473 3.436 3.408 3.386 3.368 3.353 3.330 3.299 3.280 3.267 3.258 3.206 3.198 6.713 5.840 5.310 4.957 4.706 4.518 4.373 4.258 4.164 4.086 4.021 3.965 3.917 3.874 3.837 3.804 3.684 3.607 3.553 3.514 3.484 3.461 3.442 3.426 3.402 3.369 3.349 3.335 3.325 3.270 3.262
Example Virtual Training of Lifeboat Task k = 4 => c = 4(4-1)/2 = 6 Comparisons among Treatment Means = = = = = = = = 4.430 64 4 60 6 ... 16 2.729 MSE n k c n n .025,6,60 t 1 4 1 1 ( ) = + = = 2.729 4.430 2.729 0.744 2.030 B ' ii 16 16 = = = = 4.931 7.708 6.736 6.875 y y y y 1 2 y 3 4 ( ) = = Trt 2 vs Trt 1: 7.708 4.931 2.777 2-Sided CI: 2.777 2.030 0.747 , 4.807 y 2 1 ( ( ) ) = 4.931 1.805 2-Sided CI: 1.805 = Trt 3 vs Trt 1: 6.736 2.030 0.225,3.835 y y 3 1 = 6.875 4.931 1.944 2-Sided CI: 1.944 = 0.086,3.974 ( ( 2.863,1.197 ( 030 1.891, 2.169 Trt 4 vs Trt 1: 2.030 y y 4 1 ) ) = 6 7.708 0.972 2-Sided CI: = 3.974,1.058 Trt 3 vs Trt 2: 6.73 0.972 2.030 y y 3 2 = 6.875 7.708 0.833 2-Sided CI: = 0.833 2.030 Trt 4 vs Trt 2: y y 4 2 ) = 6.875 6.736 = Trt 4 vs Trt 3: 0.139 2-Sided CI: 0.139 2. y y 4 3 Only Treatments 1 and 2 are significantly different (their means differ by more than 2.030, and equivalently, CI does not contain 0)
Tukeys Honest Significant Difference Procedure Derived so that the probability that at least one false difference is detected is E (experimentwise error rate) Makes use of the Studentized Range q-table, indexed by the number of treatments k, error degrees of freedom = n -k, E All comparisons are 2-sided MSE n = = given in Studentized Range table with HSD q q n -t ' , , k ii Conclude if y y HSD ' ' ' i i ii i i ( ) Tukey's Confidence Interval: y y HSD ' ' ii i i q 1 n 1 n = + , , 2 k If sample sizes unequal, use (Tukey-Kramer) HSD MSE ' ii ' i i
Tukey Critical Values 2-Sided E = 0.05 2-Sided (0.05)- Tukey (Studentized Range) df\k 3 5 4.602 6 4.339 7 4.165 8 4.041 9 3.948 10 3.877 11 3.820 12 3.773 13 3.734 14 3.701 15 3.673 16 3.649 17 3.628 18 3.609 19 3.593 20 3.578 25 3.523 30 3.486 35 3.461 40 3.442 45 3.428 50 3.416 55 3.406 60 3.399 70 3.386 90 3.370 110 3.360 130 3.353 150 3.348 1000 3.319 10000 3.315 4 5 6 7 8 9 10 5.218 4.896 4.681 4.529 4.415 4.327 4.256 4.199 4.151 4.111 4.076 4.046 4.020 3.997 3.977 3.958 3.890 3.845 3.814 3.791 3.773 3.758 3.747 3.737 3.722 3.702 3.689 3.681 3.674 3.639 3.634 5.673 5.305 5.060 4.886 4.755 4.654 4.574 4.508 4.453 4.407 4.367 4.333 4.303 4.276 4.253 4.232 4.153 4.102 4.066 4.039 4.018 4.002 3.989 3.977 3.960 3.937 3.922 3.912 3.905 3.865 3.858 6.033 5.628 5.359 5.167 5.024 4.912 4.823 4.750 4.690 4.639 4.595 4.557 4.524 4.494 4.468 4.445 4.358 4.301 4.261 4.232 4.209 4.190 4.176 4.163 4.144 4.118 4.102 4.091 4.083 4.038 4.031 6.330 5.895 5.606 5.399 5.244 5.124 5.028 4.950 4.884 4.829 4.782 4.741 4.705 4.673 4.645 4.620 4.526 4.464 4.421 4.388 4.364 4.344 4.328 4.314 4.293 4.265 4.248 4.236 4.227 4.178 4.170 6.582 6.122 5.815 5.596 5.432 5.304 5.202 5.119 5.049 4.990 4.940 4.896 4.858 4.824 4.794 4.768 4.667 4.601 4.555 4.521 4.494 4.473 4.455 4.441 4.419 4.389 4.370 4.357 4.348 4.295 4.287 6.801 6.319 5.997 5.767 5.595 5.460 5.353 5.265 5.192 5.130 5.077 5.031 4.991 4.955 4.924 4.895 4.789 4.720 4.671 4.634 4.606 4.584 4.566 4.550 4.527 4.495 4.475 4.461 4.451 4.396 4.387 6.995 6.493 6.158 5.918 5.738 5.598 5.486 5.395 5.318 5.253 5.198 5.150 5.108 5.071 5.037 5.008 4.897 4.824 4.773 4.735 4.705 4.681 4.662 4.646 4.621 4.588 4.567 4.553 4.542 4.484 4.475
Example Virtual Training of Lifeboat Task k = 4 Treatment Means = = = = = = = = 4.430 64 4 60 4 ... 16 3.737 MSE n k k n n .05,4,60 q 1 4 1 ( ) = = = 3.737 4.430 3.737 0.526 1.966 HSD ' ii 16 = = = = 4.931 7.708 6.736 6.875 y y y y 1 2 y 3 4 ( ) = = Trt 2 vs Trt 1: 7.708 4.931 2.777 2-Sided CI: 2.777 1.966 0. 811, 4.743 y 2 1 ( ( ) = 4.931 1.805 2-Sided CI: 1.805 1.966 = Trt 3 vs Trt 1: 6.736 0.161,3.771 y y 3 1 ) = 6.875 4.931 1.944 2-Sided CI: 1.944 1.966 = Trt 4 vs Trt 1: 0.022,3.910 ( ( 2.799,1.133 y y 4 1 ) ) = 0.972 2-Sided CI: = 0.972 1.966 2.938, 0.994 Trt 3 vs Trt 2: 6.736 7 .708 y y 3 2 = 6.875 7.708 0.833 2-Sided CI: = 0.833 1.966 Trt 4 vs Trt 2: y y 4 2 ( ) = 6.875 6.736 = Trt 4 vs Trt 3: 0.139 2-Sided CI: 0.139 1.966 1.827, 2.105 y y 4 3 Only Treatments 1 and 2 are significantly different (their means differ by more than 1.966, and equivalently, CI does not contain 0)
R Program/Output vt <- read.csv( "http://users.stat.ufl.edu/~winner/data/virtual_training.csv") attach(vt); names(vt) grp.trt <- factor(grp.trt) mod1 <- aov(procKnow ~ grp.trt) TukeyHSD(mod1) > TukeyHSD(mod1) Tukey multiple comparisons of means 95% family-wise confidence level diff lwr upr p adj 2-1 2.7777875 0.8113167 4.7442583 0.0023332 3-1 1.8055563 -0.1609146 3.7720271 0.0829543 4-1 1.9444438 -0.0220271 3.9109146 0.0537097 3-2 -0.9722313 -2.9387021 0.9942396 0.5624876 4-2 -0.8333438 -2.7998146 1.1331271 0.6788308 4-3 0.1388875 -1.8275833 2.1053583 0.9976681
Welchs F-Test Unequal Variance Case Based on the treatment sample sizes, means, and variances, compute: n w w w s = = = 1 C F m F = k = = i i i 2 i 1 i 2 k w y i i 1 k 2 = 1 i * F w y i i 1 k w = 1 i ( k ) 1 2 2 2 1 k 1 w w k = + 1 1 i C m C W W W 2 1 n = 1 i i 3 approx ~ = * F 1, W W W W k 2 1 k W
Example Virtual Training of Lifeboat Task Trt n ybar s s^2 w=n/s^2 w*ybar 4.2512 7.8243 2.0120 4.0403 18.1279 122.6027 850.4959 w*ybar^2 C_W 1 2 3 4 16 16 16 16 4.931 7.708 6.736 6.875 1.94 1.43 2.82 1.99 3.7636 2.0449 7.9524 3.9601 20.9629 103.3681 60.3100 464.8698 13.5526 27.7771 190.9674 0.0391 0.0215 0.0527 0.0403 0.1536 91.2906 sum 2 k w y ( ) 2 i i 122.6027 18.1279 1 1 k 2 = = = = 1 i * 850.4949 7.1026 F w y i i 1 4 1 k w = 1 i 2 1 w w k = = 1 0.1536 i C W 1 n = 1 i i ( k ) ( 4 )( 1 2 2 1 2 4 2 k ) = + = + = 1 1 0.1536 0.9607 m C W W 2 2 1 1 1 3 3 ( ) ( ) = = = = = = * 0.1536 32.55 0.9607 7.1026 6.8235 C F m F W W W W 2 2 1 2.896 = 4 1 k ( = ) ( ) qf .95,3,32.55 in R 0.05,3,32.55 F ( ) ( ) ( ) 6.8235 0.0011 1-pf 6.8235,3,32.55 in R P F 3,32.55
R Commands with oneway.test Function oneway.test(procKnow ~ grp.trt, var.equal=F) > oneway.test(procKnow ~ grp.trt, var.equal=F) One-way analysis of means (not assuming equal variances) data: procKnow and grp.trt F = 6.827, num df = 3.000, denom df = 32.562, p-value = 0.001072
Pairwise Comparisons Games-Howell Method When the variances are unequal, one approach is the Games-Howell Procedure Tukey type Test/CI s making use of Studentized Range (q) Uses Satterthwaite approximation for approximate degrees of freedom for pairs of treatments (different pairs, different dfs) 2 2 i 2 i s n s n + ' q 2 i 2 i s n s n , , 2 k = = + ' i i ' GH ' E ii ( ) ( ) ' ' ii ii 2 2 2 i n 2 i n s n s n ' i i ' ' i i + 1 1 ' i i Conclude if y y GH ' ' ' i i ii i i ( ) ( ) Approximate Simultaneous 1 100% CI's for : y y GH ' ' ' E i i ii i i
CRD with Non-Normal Data Kruskal-Wallis Test Extension of Wilcoxon Rank-Sum Test to k > 2 Groups Procedure: Rank the observations across groups from smallest (1) to largest (n = n1+...+nk), adjusting for ties by giving all observations the average of the ranks they would have received if not tied. If 3 measurements tie for the smallest, they each get rank (1+2+3)/3=2 Compute the rank sums for each group: T1,...,Tk . Note that T1+...+Tk= 1+ +n =n (n +1)/2
Kruskal-Wallis Test H0: The k population distributions are identical (All medians equal) HA: Not all k distributions are identical (Not all medians equal) 2 12 T n ( ) k = + . .: T S H 3 1 i n + = ( 1) n n 1 i i ( ) = 2 2 k . .: R R H P P H , 1 1 k An adjustment to H is suggested when there are many ties in the data. H = th ' number of observations in group of tied ranks H t j ( 3 ) j 3 j t t j j 1 n n
Example Virtual Training of Lifeboat Task PKScore1 PKScore2 PKScore3 PKScore4 Rank1 4.5614 5.4532 6.6593 8.9208 5.6427 8.3489 6.4394 8.3175 4.8635 9.7848 0.3268 6.2697 5.699 7.1327 6.3545 7.0886 6.7509 5.0733 6.6019 8.3865 3.2365 9.4227 6.1655 8.9142 2.406 8.515 1.9851 6.8198 5.2198 8.639 5.9765 6.2467 Rank2 Rank3 Rank4 1.8773 6.1884 6.8029 9.4535 8.7312 6.4198 8.4955 5.9008 3.3336 1.653 9.471 7.2818 9.7649 3.4931 8.9848 9.9261 9.8257 8.9988 5.4112 4.9396 8.6486 5.1459 7.0656 7.9552 5.7284 6.6314 7.5014 8.2456 4.2465 3.2286 6.552 9.8754 11 34 19 30 12 1 20 28 35 32 7 24 5 4 16 23 301 18 54 46 45 61 27 40 39 14 47 57 53 49 37 50 26 663 3 62 56 17 13 51 15 38 43 21 33 42 44 10 6 31 63 545 25 36 58 52 29 48 22 8 2 59 41 60 9 55 64 571 Sum : Teaching Medians are all Equal = + = ( : Teaching Medians not all equal + H H 0 A 2 2 2 2 12 (301) 16 (663) 16 (571) 16 (545) 16 + + + = 207.92 195 12.92 = . .: T S H 3(64 1) ( ) 64 64 1 2 .05,4 1 = = . .( R R 0.05): 7.815 ) = H 2 value: 12.92 0.0048 P P H 3
R Commands kruskal.test Function kruskal.test(procKnow ~ grp.trt) > kruskal.test(procKnow ~ grp.trt) Kruskal-Wallis rank sum test data: procKnow by grp.trt Kruskal-Wallis chi-squared = 12.915, df = 3, p-value = 0.004824
Nonparametric Comparisons Based on results from Kruskal-Wallis Test Makes use the Rank-Means for the k treatments If Kruskal-Wallis test is not significant, do not compare any pairs of treatments Compute the k(k-1)/2 absolute Rank-Means differences Makes use of the Studentized Range (q) Table For large-samples, conclude treatments are different if: ( ) + q 1 n n 1 n 1 n , , 2 Ek + T T KW ' i i ' ii 12 ' i i
Example Virtual Training of Lifeboat Task ( ) + q 1 n n 1 n 1 n , , 2 = k + T T KW E ' i i ' ii 12 ' i i = = = = 4 ... 16 64 3.858 k n n n q 1 4 , , k E ( ) 64 65 12 663 = 3.858 1 1 + = = 2.728(6.583) 17.959 KW ' ii 16 571 = 16 2 = = = 301 = 545 T T T T = 1 2 3 4 = 18.813 = = 41.438 35.688 34.063 T T T T 1 2 3 4 = 41.438 18.813 22.625 17.959 T T 2 1 35.688 18.813 16.875 17.959 = T T 3 1 Only Treatments 1 and 2 differ significantly
