Understanding Bar Charts and Pictograms in Mathematics
Bar charts and pictograms are visual ways to represent data. It is essential to interpret the key and scale correctly to derive accurate information from the charts. Pay attention to details and calculations to analyze the data effectively.
Download Presentation

Please find below an Image/Link to download the presentation.
The content on the website is provided AS IS for your information and personal use only. It may not be sold, licensed, or shared on other websites without obtaining consent from the author. Download presentation by click this link. If you encounter any issues during the download, it is possible that the publisher has removed the file from their server.
E N D
Presentation Transcript
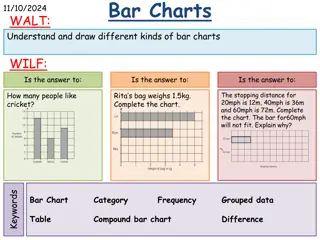
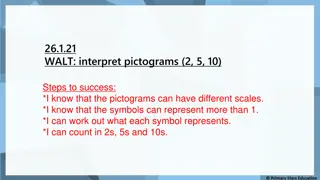
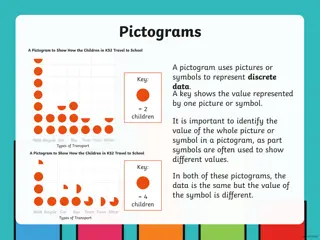
Using bar charts and pictograms. We can show information in bar charts as well as on pictograms. On a pictogram, it is really important to look at the key to see what each individual picture represents. This is the same with a bar chart. The numbers on the side are called the scale. The scale can go up in different size jumps depending on how many things are being counted. Remember to look at the scale so you look at the information on the bar chart correctly.
Why arent Saturday and Sunday on the chart? Look carefully at the scale.
How many children went on each of these days? Look carefully at the scale.
Look carefully at the scale.
Remember to show how you worked out your answers. This might be a calculation.
Remember to show how you arrived at your decision. This might be a calculation.


