Understanding Different Types of Bar Charts with Examples
Explore the world of bar charts through various examples such as favorite subjects, animals, and sports, along with practical exercises. Learn to interpret and draw different types of bar charts like compound, comparative, and composite charts. Discover how to represent data visually and analyze key details from the information provided in each scenario.
Download Presentation

Please find below an Image/Link to download the presentation.
The content on the website is provided AS IS for your information and personal use only. It may not be sold, licensed, or shared on other websites without obtaining consent from the author. Download presentation by click this link. If you encounter any issues during the download, it is possible that the publisher has removed the file from their server.
E N D
Presentation Transcript
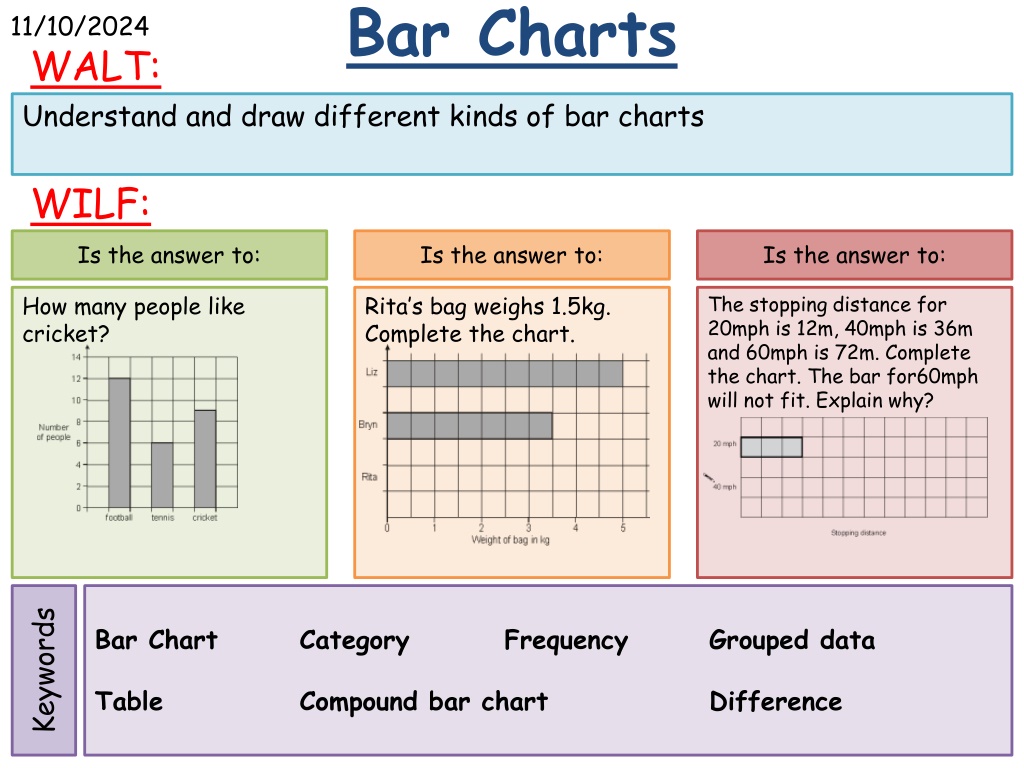
Bar Charts 11/10/2024 WALT: Understand and draw different kinds of bar charts WILF: Is the answer to: Is the answer to: Is the answer to: How many people like cricket? Rita s bag weighs 1.5kg. Complete the chart. The stopping distance for 20mph is 12m, 40mph is 36m and 60mph is 72m. Complete the chart. The bar for60mph will not fit. Explain why? Keywords Bar Chart Category Frequency Grouped data Table Compound bar chart Difference
Bar Charts 11/10/2024 Starter: Complete the missing information in the table (Pictogram) Favourite Subject Maths Key: Pictogram Frequency = 4 people 8 English 10 Science 9 Art 12 PE 14 History 7
Bar Charts 11/10/2024 Starter: Complete the Tally Chart Below Favourite Animal Dog Tally Frequency Cat Rabbit 4 Hamster 13 Other 6
Bar Charts 11/10/2024 Key Question: Tim's class collected information about all their pets. They have six different kinds of pets between them. This is the block graph they are making to show how many of each pet the class has altogether. The children have not yet put in the animal names under each column. Can you do this for them using the information below? There are two less cats than dogs. Only one child has a parrot at home. The number of fish added to the number of gerbils is equal to the number of dogs. There are twice as many fish as hamsters. There are half the number of gerbils as there are cats.
Bar Charts: Favourite Subject Maths Draw a bar chart for this set of data. 14 Freq. 13 12 8 11 English 10 10 9 Frequency Science 9 8 7 Art 12 6 5 PE 14 4 History 7 3 2 1 0 Maths English Science Art PE History a PE Which subject was most popular? 14 7 = 7 b Work out the difference between PE and History.
Comparative Bar Charts: Fav. Sport Football Boys Girls Netball 2 10 Basketball 5 2 Tennis 3 4 Other 2 3 8 3 Key: Boys Girls The information in the table shows the sports boys and girls in year 7 enjoy the most. 10 9 a Draw a bar chart 8 Frequency 7 b 6 Using the bar chart work out the difference between the boys favourite sport and the girls favourite sport. 5 4 3 2 1 0 10 8 = 2
Composite Bar Charts: Age TV 10 - 20 2 21 40 3 41 + 5 Newspapers 0 2 5 Internet 5 6 2 Social Media 7 3 2 Other 1 2 2 Key: 10 - 20 21 - 40 40+ 13 The table above shows where people get their news from. 12 11 10 9 Frequency 8 a Draw a bar chart 7 6 b Where do most people like to get there news from? 5 4 3 2 1 0
Bar Charts 11/10/2024 Key Question: Tim's class collected information about all their pets. They have six different kinds of pets between them. This is the block graph they are making to show how many of each pet the class has altogether. The children have not yet put in the animal names under each column. Can you do this for them using the information below? There are two less cats than dogs. Only one child has a parrot at home. The number of fish added to the number of gerbils is equal to the number of dogs. There are twice as many fish as hamsters. There are half the number of gerbils as there are cats.
Bar Charts 11/10/2024 WALT: Understand and draw different kinds of bar charts WILF: Is the answer to: Is the answer to: Is the answer to: How many people like cricket? Rita s bag weighs 1.5kg. Complete the chart. The stopping distance for 20mph is 12m, 40mph is 36m and 60mph is 72m. Complete the chart. The bar for60mph will not fit. Explain why? Keywords Bar Chart Category Frequency Grouped data Table Compound bar chart Difference


