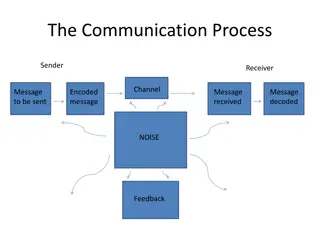
Data Presentation Techniques for Effective Communication
Explore various data presentation methods including charts, tables, and graphs to effectively communicate data insights. Learn about different types of charts, their uses, and guidelines for creating impactful visual representations. Dive into examples of bar charts, pareto charts, and pie charts to enhance your data storytelling skills.

Download Presentation

Please find below an Image/Link to download the presentation.
The content on the website is provided AS IS for your information and personal use only. It may not be sold, licensed, or shared on other websites without obtaining consent from the author.If you encounter any issues during the download, it is possible that the publisher has removed the file from their server.
You are allowed to download the files provided on this website for personal or commercial use, subject to the condition that they are used lawfully. All files are the property of their respective owners.
The content on the website is provided AS IS for your information and personal use only. It may not be sold, licensed, or shared on other websites without obtaining consent from the author.
E N D
Presentation Transcript
IMGD 2905 Presenting Data Chapter 2
Outline Types of Charts Game Analytics Examples Guidelines for Charts (next)
Tables Generally, independent variable in left column and dependent variables next Table 1. Number of student on campus and off by year Checklist Number and caption Units labeled (as appropriate) Minimal vertical lines (or none) Lines only to break apart areas (or use Bold) Make sure to consider message. Often much clearer in chart!
Right Chart Depends on Variable Type Qualitative (Categorical) variables Can have states or subclasses e.g., position: [striker, goalie, midfield] Can be ordered or unordered e.g., bronze, silver, gold ordered e.g., support, warrior, specialist unordered Quantitative (Numeric) variables Numeric levels Discrete or continuous e.g., goals in season, speed in meters e.g., takedowns, win percentage Variables Qualitative Quantitative Ordered Unordered Discrete Continuous
Categorical: Bar Chart (1 of 2) Chart containing rectangles ( bars ) where length represents count, amount, or percent (aka column chart ) Better than table for comparing numbers https://www.kristakingmath.com/blog/bar-graphs-and-pie-charts https://www.kristakingmath.com/blog/bar-graphs-and-pie-charts Olympic Games Hosted Continent
Categorical: Bar Chart (2 of 2) Chart containing rectangles ( bars ) where length represents count, amount, or percent https://www.kristakingmath.com/blog/bar-graphs-and-pie-charts https://www.kristakingmath.com/blog/bar-graphs-and-pie-charts
Categorical: Pareto Chart Bar chart, arranged most to least frequent Line showing cumulative percent Helps identify most common https://usercontent2.hubstatic.com/3767965_f520.jpg Sort by column D (Data -> Sort high to low) New column E for percent [=D2/SUM(D$2:D$11)] Note: $ locks value in (e.g., D$2 versus D2) New column F for running [=SUM(E$2:E2)] Select B, D and F. Insert combo chart
Categorical: Pie Chart Wedge-shaped areas ( pie slices ) represent count, amount or percent of each category from whole Compare relative amounts at a glance Best if few slices since quantifying size of pie difficult Comparing pies also difficult The Effects of Latency and Jitter on a First Person Shooter: Team Fortress 2 http://www.cs.wpi.edu/~claypool/iqp/tf2/
Histogram Bar chart for grouped numerical data - No gaps btwn adjacent bars #kills winners make in PUBG Select GPA data Insert Statistics Chart Histogram Can adjust bins, overflow/underflow https://theparttimeanalyst.com /2018/12/10/pubg-eda/ 0 5 10 15 20 http://www.leaguemath.com/e arly-vs-late-game-champions/ Kills https://www.mathsisfun.com/data/images/bar-chart-vs-histogram.gif
Time Series Plot Associate data with date Line graph with dates (proportionally spaced!) http://www.soundandvision.com/content/violence-and-video-games http://www.polygon.com/2014/9/12/6141515/do-violent-video-games-actually-reduce-real-world-crime Sel. year and majors Insert Line Chart More Line Charts
Two Variables Scatter Plot Two numerical variables, one on each axis Reveal patterns in relationship Setup right models (later) Intelligent Simulation of Worldwide Application Distribution for OnLive's Server Network http://www.cs.wpi.edu/~claypool/mqp/onlive/ Select two of {win, pick, ban} Insert scatter plot
Radar Chart (1 of 2) Also called star , spider , web or kiviat charts Good for quick visual comparison, especially when axes unequal PUBG game comparison Select top line {win, pick, ban} + 3 row s (Ctrl-select) Insert Other Radar scatter plot https://www.exceltip.com/wp-content/uploads/2019/11/00213.png Note: need to normalize data to scale Axes Insert column E ( B Norm ) =E2/MAX(E$2:E42) Copy and paste down
Radar Charts (2 of 2) Note, axes themselves hard to read values Value is to compare shapes https://www.data-to- viz.com/caveat/spider.html
Many More Charts! https://en.wikipedia.org/wiki/Chart Bubble Waterfall Tree Gap Polar Violin Candlestick Kagi Gantt Nolan Pert Smith Skyline Vowel Nomogram Natal If common chart effective for message, use Otherwise, learn/use other charts as needed But remember may need to explain how to read
Outline Types of Charts Game Analytics Examples Guidelines for Charts (done) (next)
Game Analytics Visual Analysis Gunter Wallner and Simone Kriglstein. An Introduction to Gameplay Data Visualization , Game Research Methods, pages 231-250, ETC Press, ISBN: 978-1-312-88473-1, 2015. http://dl.acm.org/citation.cfm?id=2812792 Player choices (e.g., build units) Density of activities (e.g., where spend time on map) Movement through levels
Player Choices Pie-Chart (Custom game, comparative study)
Player Location Heat Map (2 of 2) Assassin s Creed Where play testers failed Result: Make red areas easier http://www.gamasutra.com/blogs/JonathanDankoff/20140320/213624 /Game_Telemetry_with_DNA_Tracking_on_Assassins_Creed.php
Note, Heat Map for Tables, Too! Red means sales are low Excel tutorial at: https://trumpexcel.com/heat-map-excel/
Movement (1 of 2) (game: Infinite Mario, clone of Super Mario Bros.)
Outline Types of Charts Game Analytics Examples Guidelines for Charts (done) (done) (next) https://xkcd.com/1945/
Guidelines for Good Charts (1 of 7) Require minimum effort from reader Perhaps most important metric Given two, can pick one that takes less reader effort a b c a b e.g., c Direct Labeling Legend Box
Guidelines for Good Charts (2 of 7) Maximize information Make self-sufficient Key words in place of symbols e.g., Gold IV and not Player A e.g., Daily Games Played not Games Played Axis labels as informative as possible e.g., Game Time (seconds) not Game Time Help by using captions (or title, if stand-alone) e.g., Game time in seconds versus player skill in total hours played http://www.phplot.com/phplotdocs/conc-labels.html
Guidelines for Good Charts (3 of 7) Minimize ink https://www.slideshare.net/NicoleMarinsek/darkhorse-line-chart
Guidelines for Good Charts (4 of 7) Use commonly accepted practices Present what people expect e.g., origin at (0,0) e.g., independent (cause) on x-axis, dependent (effect) on y-axis e.g., x-axis scale is linear e.g., increase left to right, bottom to top e.g., scale divisions equal, proportional Departures are permitted but require extra effort from reader so use sparingly! vs.
Guidelines for Good Charts (5 of 7) Avoid ambiguity Show coordinate axes at right angles Show origin usually at (0,0) Identify individual curves and bars With key/legend or label Do not plot multiple variables on same chart Single y-axis vs. http://www.carltonassociatesinc.com/images/confusion-new.jpg
Guidelines for Good Charts (6 of 7) Don t connect categorical data with lines Lines joining successive points signify that they can be approximately interpolated If don t have meaning, should not use line chart - No linear relationship between champion types - Don t connect with lines - Instead, use column chart Assists jungle top mid support
Guidelines for Good Charts (7 of 7) Avoid pictorial charts and focus on meaning Missing x-axis (1997 too far over) Missing y-axis hard to compare (1950 height > 1970) Data points unclear
Groupwork Improving Bad Charts 1. Work Solo: Study chart. Identify improvements. Write down. 2. Work as a Team: Compare lists. Discuss. 3. Write down combined. https://web.cs.wpi.edu/~imgd2905/d23/groupwork /2-bad-charts/handout.html
Checklist for Good Charts Axes Are both axes labeled? Are the axis labels self-explanatory and concise? Are the scale and divisions shown on both axes? Are the min and max ranges appropriate? Are the units indicated? Lines/Curves/Points Is the number of lines/curves reasonably small? Are curves labeled? Are all symbols clearly distinguishable? Is a concise, clear legend provided? Does the legend obscure any data? Information If the y-axis is variable, is an indication of spread (error bars) shown? Are grid lines required to read data (if not, then remove)? Scale Are units increasing left to right (x- axis) and bottom to top (y-axis)? Do all charts use the same scale? Are the scales contiguous? Is bar chart order systematic? Are bars appropriate width, spacing? Overall Does the whole chart add information to reader? Are there no curves/symbols/text that can be removed and still have the same information? Does the chart have a title or caption (not both)? Is the chart self-explanatory and concise? Do the variables plotted give more information than alternatives? Is chart referenced and discussed in any accompanying report?
Describing Chart in Report & Presentation Formula Describe all axes E.g., The x-axis is time since game began, in seconds Describe data sets/trendlines E.g., The blue dots are the average maze completion time Then provide message E.g., Notice how the red bar is higher than the blue, indicating that Example on Web page http://web.cs.wpi.edu/~imgd2905/d23 /samples/analysis-example.html
Guidelines for Good Charts (Summary) For each chart, go over checklist The more yes answers, the better Remember, while guidelines, art and not science So, may consciously decide not to follow these guidelines if better without them but have good reason! In practice, takes several trials before arriving at best chart Want to present message the most: accurately, simply, concisely, logically Accompany with description! Text or verbal Remember, audience/reader has not seen! Make sure to introduce


")
")


")
")


")
")

")
")

")
")
")
")
")
")
")


")