Seasonal and Longitudinal Trends in University Students' Workload in Aotearoa
This study examines the workload of university students in Aotearoa, focusing on seasonal and longitudinal trends. The research, conducted by Daniel Wrench and Dr. Sarah Randal from Universities New Zealand along with Dr. John Randal from VUW, explores estimated mean weekly hours worked, annual employment rates, and percentage of employed students working in different industries. Current limitations and methods used in the study are also discussed. The data analyzed are not official statistics but were obtained from the Integrated Data Infrastructure (IDI) provided by Stats NZ.
Download Presentation

Please find below an Image/Link to download the presentation.
The content on the website is provided AS IS for your information and personal use only. It may not be sold, licensed, or shared on other websites without obtaining consent from the author. Download presentation by click this link. If you encounter any issues during the download, it is possible that the publisher has removed the file from their server.
E N D
Presentation Transcript
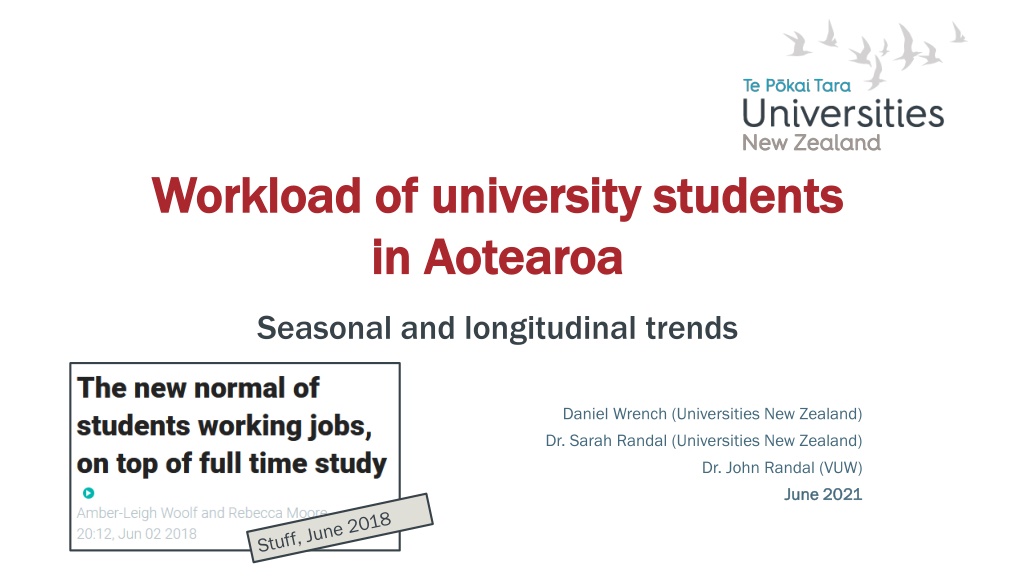
Workload of university students Workload of university students in Aotearoa in Aotearoa Seasonal and longitudinal trends Daniel Wrench (Universities New Zealand) Dr. Sarah Randal (Universities New Zealand) Dr. John Randal (VUW) June 2021 June 2021
METHOD METHOD Current limitations: Current limitations: IRD datasets don t have data on hours worked. Census an unsatisfactory alternative. 26 September 2024 2
Estimated Estimated mean weekly hours worked by month: mean weekly hours worked by month: Estimated Estimated mean weekly hours worked by month: mean weekly hours worked by month: full-time domestic (2009 & 2019) full-time international (2009 & 2019) RESULTS RESULTS 30 30 25.6 24.7 25 25 19.3 19.0 20 20 Annual employment rates Annual employment rates of young Bachelor's degree students (2009 & 2019) 15 15 11.7 10.7 10.4 9.7 10.3 10.1 10.4 8.8 10 10 100% 5 5 90% - - 85% 82% Jan Jan Feb Feb Mar Mar Apr Apr May May Jun Jun Jul Jul Aug Aug Sep Sep Oct Oct Nov Nov Dec Dec 80% 2009 2009 2019 2019 70% Percentage of employed students working in each industry Percentage of employed students working in each industry (2019) 60% 50% 70% 58% 39% 60% 40% 34% 50% 44% 43% 30% 40% 25% 30% 20% 18% 20% 13% 10% 10% 0% 0% Accommodation and Food Services Retail Trade Other industry Domestic International Domestic International 3
Workload of university students in Aotearoa Workload of university students in Aotearoa Seasonal and longitudinal trends Daniel Wrench Daniel Wrench Universities New Zealand Universities New Zealand daniel.wrench@universitiesnz.ac.nz daniel.wrench@universitiesnz.ac.nz IDI disclaimer IDI disclaimer These results are not official statistics. They have been created for research purposes from the Integrated Data Infrastructure (IDI). Access to the data used in this study was provided by Stats NZ under conditions designed to give effect to the security and confidentiality provisions of the Statistics Act 1975. The results presented in this study are the work of the UNZ, not Stats NZ or individual data suppliers. The results are based in part on tax data supplied by Inland Revenue to Stats NZ under the Tax Administration Act 1994 for statistical purposes. Any discussion of data limitations or weaknesses is in the context of using the IDI for statistical purposes, and is not related to the data s ability to support Inland Revenue s core operational requirements.
