Seasonal Forecasting: Temperature and Precipitation Outlooks
Explore the world of seasonal forecasting through this presentation, covering topics such as the definition of seasonal forecast, sources of predictability, real-time forecasting over the Arctic, and the importance of ensembles in forecasting accuracy. Discover how seasonal outlooks play a crucial role in decision-making processes, illustrated with examples from the Arctic Regional Climate Center.

Download Presentation

Please find below an Image/Link to download the presentation.
The content on the website is provided AS IS for your information and personal use only. It may not be sold, licensed, or shared on other websites without obtaining consent from the author.If you encounter any issues during the download, it is possible that the publisher has removed the file from their server.
You are allowed to download the files provided on this website for personal or commercial use, subject to the condition that they are used lawfully. All files are the property of their respective owners.
The content on the website is provided AS IS for your information and personal use only. It may not be sold, licensed, or shared on other websites without obtaining consent from the author.
E N D
Presentation Transcript
DRAFT PARCOF: Temperature and Precipitation Outlooks Presentation Marko Markovic, Bertrand Denis and Gabrielle Gascon With support from: Adrienne Tivy and Arun Kumar 1
Plan DRAFT Introductory Part on the seasonal forecasting - what is seasonal forecast (outlook) - timescales, sources of predictability and skill - why do we need ensembles an multi-model ensembles - how skillful are seasonal forecast in general T2m and precip seasonal real time seasonal forecasting over the Arctic: - Temperature outlook over the Arctic - How to use real-time outlooks combined with the historical skill - Precipitation outlook over the Arctic. - what can we do more with the Arctic Regional Climate Center (ArcRCC) Example on decision making : cost/lost ratio 2
Introduction to Seasonal Forecasting What is Seasonal Forecast? - - Probably all are familiar with the weather forecasts. Range of the weather forecast can be from 6h (now casting) to up the two weeks in advance (long range weather forecast). On the figure we have ECCC 7- day (mid range ) forecast for the city of Montreal. DRAFT (e.g. temperature, pressure, humidity) at the time we want to perform the forecast. - How do we do it? We have a tool, a weather forecasting model, which is a set of mathematical equations. We also need the current/initial state of the atmosphere - On the figure: near surface temperature state on the 16th April 2018 (takes into account storm tracks ..) https://www.esrl.noaa.gov 3
Introduction to Seasonal Forecasting What is Seasonal Forecast? - If we take a weather forecasting model (set of mathematical equations) and we add to it an ocean forecasting model we will obtain a climate forecasting model. First day we can forecast the weather but not after one month. Capable to give us set of weather realisations for one year and even far beyond. DRAFT Seasonal Outlook represents a 90-day average of the seasonal forecast s daily realisations. We can also construct a monthly outlook which is a 30 day averaged daily realisation In this talk we will focus on seasonal outlooks! - 1 year - Seasonal Forecast is a climate forecast ranging up to 1 year ahead. Season 1 Season 2 December January June 2019 15 May 2018 June July August September November February April May October March - - - 4
Introduction to Seasonal Forecasting Seasonal Forecast Skill? - - Skill is a measure of the forecast s accuracy. We use historical observations (e.g. temp, precip) to compare our forecasts to. DRAFT time we want to perform the forecast. After 2 weeks weather model forgets the initial condition state and starts to drift away from them. 2 weeks Very low skill Not very useful in terms of daily forecasts ~95% ~90% ~65% - Thus, how the seasonal outlook (90 day average) can be useful if we lose skill in weather forecast after two weeks? Surface air temp 4th April 2018 - weather forecasting model depends on the current/initial state of the atmosphere (e.g. temperature, pressure, humidity) at the - 5
Introduction to Seasonal Forecasting Seasonal Forecast Skill? DRAFT Climate model (seas forecast) = weather model + ocean model + boundary forcing description - Weather Forecast up to two weeks - and also on the initial state of the atmosphere. Seasonal forecast 3 months, depends on the slowly evolving boundary conditions - Boundary conditions influencing the seasonal forecasting skill: - Changes in the Ocean (e.g. El Nino, Pacific Decadal Oscillation) - Changes in the land (e.g. soil moisture, snow cover) - Changes in the Atmosphere (e.g. circulation patters NAO, PNA ) NAO, appears very often and influences seasonal climate for ~3 weeks El Nino, appears once in 3-5 years and influences seasonal climate for 9 months Snow depth (22 Feb 2016 source ECCC), appears every year and influences seasonal climate during its presence, depending on the region. 6 https://www.metoffice.gov.uk
Introduction to Seasonal Forecasting Why do we need ensembles? DRAFT probabilistic approach (chance for all possible values). - Due to the uncertainty of the initial conditions, we are also not certain about the seasonal forecast results. forecast uncertainty Initial condition uncertainty - Comparing to only one forecast, ensemble approach is always preferred because of: - Model error annulation (average, red line), (e.g. Ensemble 1 = 2, Ensemble 2 = -2) -> deterministic approach (one value). We can use ensembles to explore chances for potential forecast results - > - - Seasonal Forecast is even better if we have several climate models (multi model approach). This is because of even more ensemble members. 7
Introduction to Seasonal Forecasting How do we communicate seasonal forecast results? DRAFT above normal - Weather forecast communicate results in terms of numbers or events. - e.g. On the 17th May 2018 it will be 18 degrees Celsius - e.g. On the 17th May 2018 light rain will start in the evening. - (remember that we have 90 days for seas forecast). - So what do we do? We calculate if the 90-day average forecast (seasonal outlook) will be: above, below or near normal. We need to define the normal or the reference period. With seasonal forecasting this is not possible because the forecast error would be very large Defining normal climate in JJA for Ottawa. We have to take 30 years of temp anomalies (thirty summers, thirty numbers) Climatology: 20 deg, we select the threshold ~68% of all summers. Temp occasion (how many times) 19.5 20.5 If the forecast for temp is higher than 20.5 we declare it above normal. Lower 19.5 deg is below normal. In between is near normal. below normal 20 30 5 8 Temperature in Celsius
Introduction to Seasonal Forecasting How do we communicate seasonal forecast results? DRAFT above its normal values. Climatology for Ottawa JJA (records for 30 summers) Temp occasion (how many times) Seasonal Forecast for Ottawa JJA 2018 60 members and .. If we have ensemble forecast with 19.5 20.5 Below normal Near normal Above normal below normal above normal 15 10 35 20 30 25% (15/60) 17% 58% 5 Temperature in Celsius We will issue the following statement: For the summer 2018 in Ottawa, there is a ~60% chance that the temperature will be Note: This is much higher than a pure chance. Since we have 3 possible occasions, pure chance is 33% (compare with a coin flip where is 50%). Chance of 60% is much higher than the one of 33%. 9
Introduction to Seasonal Forecasting How do we communicate seasonal forecast results? DRAFT temperature, but the highest confidence (~60%) we have in the Above Normal category. Climatology for Ottawa JJA (records for 30 summers) Temp occasion (how many times) Seasonal Forecast for Ottawa JJA 2018 60 members and .. If we have ensemble forecast with 19.5 20.5 Below normal Near normal Above normal below normal above normal 15 10 35 20 30 25% 17% 58% 5 Temperature in Celsius Another way to think about it. In Ottawa this summer, it is possible that we have all three predefined categories for If our forecast is lower than 33% we will not have confidence since it is inferior than a pure chance. If the forecast is : 40-60% -> low confidence ; 60-80 -> moderate to high confidence; larger than 80% -> high confidence 10
Introduction to Seasonal Forecasting How skillful are seasonal forecasts in general? DRAFT To asses real-time seasonal forecast of the multi-model ensemble, first we need to evaluate its historical performance: If MME historical forecasts were skillful it is very likely that they will be skillful in real time too! Historical forecasts (e.g.) Forecasts for every summer between e.g. 1981-2010 -> 30 summers All models all ensemble members We calculate a score (e.g. correlation coefficient) for 30 summers for temperature and precip. Anomaly Correlation Coefficient score : based on 17 years, MME mean of WMOLFC models JJA T2m JJA Precipitation 11
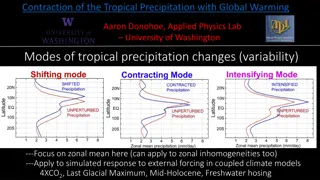
Introduction to Seasonal Forecasting How skillful are seasonal forecasts in general? DRAFT Every season (e.g. MAM, AMJ, ) has a different skill. Temperature is much better than precip (warming trend, not much precip in high latitudes). Skill is very good in tropics, limited over extra-tropics and very restricted over the Arctic. Anomaly Correlation Coefficient score : based on 17 years DJF Precipitation DJF T2m Some facts about skill: In winters better than in summers (more oscillations present). 12
DRAFT T2m and precip seasonal real time seasonal forecasting over the Arctic: - Temperature outlook over the Arctic - How to use real-time outlooks combined with the historical skill - Precipitation outlook over the Arctic. - what can we do more with the Arctic Regional Climate Center (ArcRCC) 13
Temperature outlook over the Arctic: May-June July 2018 DRAFT 1. North America 2. European Arctic 3. Wester Russia 4. Central Russia 5. Eastern Russia
Temperature outlook over the Arctic: May-June July 2018 ROC score for T2m in MJJ based on 19 years of historical data (1983-2001) DRAFT
Temperature outlook over the Arctic: May-June July 2018 ROC score for T2m in MJJ based on 19 years of historical data (1983-2001) DRAFT What would we expect for the MJJ: 1. Taymyr : We expect above normal temp, but we don t have high confidence (40%), we can make decisions based on seas forecast due to the presence of the historical skill. 2. Nunavut: We don t make decisions, no historical skill. However the forecast of above normal temp is still possible. Two examples of how to use historical ROC score with the actual real time forecasts: 1. Forecast over the Taymyr peninsula (Russia) 2. Forecast over the continental Nunavut (Canada) 1. Taymyr: 60-70% (moderate skill) 2. Nunavut: <50% (no skill) 1. Taymyr: ~40% chance for above normal 2. Nunavut: ~60% chance for above normal Historical skill according to the ROC score: Real time forecasts:
Precipitation outlook over the Arctic: May-June July 2018 DRAFT 1. North America 2. European Arctic 3. Wester Russia 4. Central Russia 5. Eastern Russia
Precipitation outlook over the Arctic: May-June July 2018 ROC score for Precipitation in MJJ based on 19 years of historical data (1983-2001) DRAFT
So, what can we conclude for the MJJ 2018 seasonal forecast over the Arctic? DRAFT Precipitation: there is a low probability of 40 or more for above average precipitation over Alaska an easternmost parts of Russia. Otherwise, there is an equal chances for above, below or near normal temperatures over the Arctic belt. Considering multi-model ensemble forecast and a limited model skill over the Arctic: T2m: There is probability of 50% or more that the temperature will be above normal in the Northwestern and northern Alaska and north western Canada. Over the European Arctic there is low probability ~40% for below normal temperature in the southwestern Norway. We expect low probability of ~40% for above average temperature in the eastern Europe and central and northern Russia. 19
What can we do more with the Arctic Regional Climate Center (ArcRCC) DRAFT ArcRCC Regional Climate Center founded by the World Meteorological Organisation to: Promote climate monitoring over the Arctic Promote seasonal and sub-seasonal forecasting over the Arctic Promote climate research over the Arctic Promote climate services over the Arctic Promote operational data to for better long range forecasts Met Service of Norway is working towards a platform (a web page) to enables all this goals to the users.
Breakout-group questions DRAFT 6. Do you think we should present this in a different way (to complex)? 7. Would you like to have a training session about using the seasonal forecast products in decision making? 1. What are seasonal forecast, seasonal forecast outlook and how we communicate it? 2. Are seasonal outlooks useful to you? 3. Which forecasting timescales (e.g. a week, a few weeks, a month, a season) are you interested in? 4. What regions or which season (e.g. spring, summer,..) are the most important to you? 5. How much skill you need in order to make a decision (real-time versus historical forecast)?
More questions, if time permits DRAFT .
Example on decision making: cost/lost ratio DRAFT
Take home messages Seasonal forecast has limited skill over the arctic region (contrary to the tropics) DRAFT .. .. . 24