Planning for Palliative Care Services in Aotearoa: Insights from Population Data
Explore vital insights and projections on palliative care services in Aotearoa, presented by actuary Heather McLeod. Discover strategic challenges, inpatient bed needs, national death trends, Maori differentials, urban vs. rural data, and regional variations for informed planning and provision of palliative care services. Engage in this informative webinar to gain essential knowledge for effective policy and clinical directions. Questions can be addressed via the Q&A function with slides and recordings available post-event.
Download Presentation

Please find below an Image/Link to download the presentation.
The content on the website is provided AS IS for your information and personal use only. It may not be sold, licensed, or shared on other websites without obtaining consent from the author.If you encounter any issues during the download, it is possible that the publisher has removed the file from their server.
You are allowed to download the files provided on this website for personal or commercial use, subject to the condition that they are used lawfully. All files are the property of their respective owners.
The content on the website is provided AS IS for your information and personal use only. It may not be sold, licensed, or shared on other websites without obtaining consent from the author.
E N D
Presentation Transcript
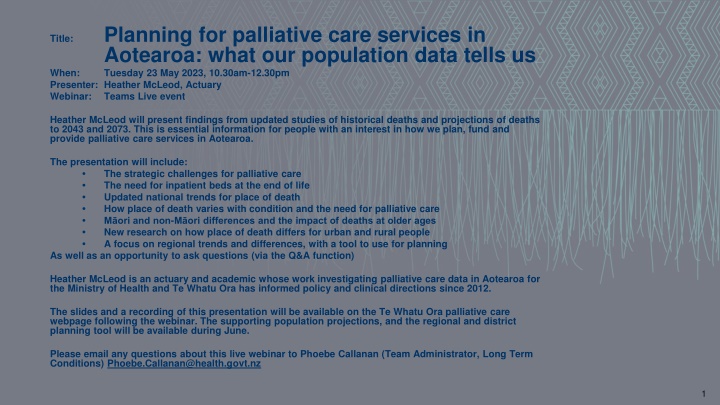
Planning for palliative care services in Aotearoa: what our population data tells us Tuesday 23 May 2023, 10.30am-12.30pm Presenter: Heather McLeod, Actuary Webinar: Teams Live event Title: When: Heather McLeod will present findings from updated studies of historical deaths and projections of deaths to 2043 and 2073. This is essential information for people with an interest in how we plan, fund and provide palliative care services in Aotearoa. The presentation will include: The strategic challenges for palliative care The need for inpatient beds at the end of life Updated national trends for place of death How place of death varies with condition and the need for palliative care M ori and non-M ori differences and the impact of deaths at older ages New research on how place of death differs for urban and rural people A focus on regional trends and differences, with a tool to use for planning As well as an opportunity to ask questions (via the Q&A function) Heather McLeod is an actuary and academic whose work investigating palliative care data in Aotearoa for the Ministry of Health and Te Whatu Ora has informed policy and clinical directions since 2012. The slides and a recording of this presentation will be available on the Te Whatu Ora palliative care webpage following the webinar. The supporting population projections, and the regional and district planning tool will be available during June. Please email any questions about this live webinar to Phoebe Callanan (Team Administrator, Long Term Conditions) Phoebe.Callanan@health.govt.nz 1
Planning for palliative care services in Aotearoa what our population data tells us 23 May 2023 Heather McLeod, Actuary and academic
Strategic Challenges Increased numbers of deaths 3 3
Births and Deaths in New Zealand 1876-2022 Entries to the world and exits from the world. Deaths have only recently exceeded 30,000 a year. Deaths will catch up to around the 60,000 level each year. Increase in 2022 deaths from COVID. 4 4 Data source: Stats NZ New Zealand cohort life tables: March 2023 update
Births and Deaths in New Zealand 1876-2022 and projections to 2073 Entries to the world and exits from the world. Deaths have only recently exceeded 30,000 a year. Deaths will catch up to around the 60,000 level each year. Deaths projected to exceed births in 2050s. 5 5 Data sources: Stats NZ New Zealand Cohort Life Tables: March 2023 update; Stats NZ National Population Projections: 2022(base) 2073
Total Deaths 1979-2073 The graph begins in 1979, the year of the first hospice in Aotearoa. National Projections are to 2073. These 50-year projections are useful for overall strategic direction and for workforce planning. 6 6 Data sources: Stats NZ Historical Deaths by age and sex (Annual-Jun; Annual-Dec); Stats NZ National Population Projections: 2022(base) 2073
Total Deaths 1979-2073 Stats NZ produces detailed projections to 2043 using Ministry of Health assumptions. The projections are updated annually, provide more detail by health district and ethnicity, and are used for planning in the health sector. Update 2022 has slightly higher projected deaths than the national projections. Data sources: Stats NZ Historical Deaths by age and sex (Annual-Jun; Annual-Dec); Stats NZ National Population Projections: 2022(base) 2073; DHB Births and Deaths Projections 2023-43 (2022 Update) 7 7
Commissioning Increased numbers of deaths relative to population 8 8
Regions 2023-2043 Population Change in population from 2023 to 2043: New Zealand 115% Northern 119%; Te Manawa Taki 115%; Central 109%; Te Waipounamu 111%. Deaths Change in deaths from 2023 to 2043: New Zealand 148% Northern 160%; Te Manawa Taki 148%; Central 138%; Te Waipounamu 143%. Data source: DHB Births and Deaths Projections 2023-43 (2022 Update) 9 9
Increases in Population and Deaths 2023 to 2073 Deaths are increasing faster than population. If the values are indexed to 1000 in 2023, then by 2073 population reaches 1291 (increase of 129%) and deaths reach 1821 (increase of 182%). 10 10 Data source: Stats NZ National Population Projections: 2022(base) 2073
Commissioning for palliative care must be based on deaths and not population, because deaths are projected to increase much faster than the population. 11 11
Ethnicity Births, Deaths and Population 2023-2043 12 12
Births Population Deaths Ethnicity 2023 M ori are 29.5% of total births, 17.5% of the population, and 12.6% of total deaths. M ori and Pacific together are 39.3% of births, 24.7% of the population, and 18.4% of total deaths. 13 13 Data source: DHB Births and Deaths Projections 2023-43 (2022 Update)
Ethnicity Deaths 2023 to 2043 M ori deaths as a percentage of total deaths are projected to increase from 12.6% in 2023 to 13.5% in 2043. The proportion of Asian deaths more than doubles over the period. 14 14 Data source: DHB Births and Deaths Projections 2023-43 (2022 Update)
Ethnicity Age Profiles 2023 The four prioritised ethnicity groups have age profiles with very different shapes (standardised within each group). M ori and Pacific have very young populations, with a small tail at older ages. Other has fewer children and young adults, and a very fat elderly tail. Asian has an unusual bulge in the tertiary student and early working years. 15 15 Data source: DHB Births and Deaths Projections 2023-43 (2022 Update)
Mori as percent of Total Deaths 2023-2043 Patterns differ by region and over time. Over the period, M ori deaths as a percent of Total deaths are projected to be roughly level for Northern and Te Manawa Taki but increase for Central and Te Waipounamu. 16 16 Data source: DHB Births and Deaths Projections 2023-43 (2022 Update)
Equity of palliative care delivery needs to be measured against the ethnicity of deaths and not the ethnicity of the population. 17 17
Strategic Challenges Deaths at Older Ages 18 18
Ageing of Deaths 1979-2073 The challenge is not only the increasing number of deaths, but the ageing of deaths. Projected deaths are at significantly older ages than what the sector has experienced historically. 19 19 Data sources: Stats NZ Historical Deaths by age and sex (Annual-Jun; Annual-Dec); Stats NZ National Population Projections: 2022(base) 2073
Ageing of Total Deaths 2023 and 2043 The ageing of projected deaths is a significant strategic challenge for palliative care. 20 20 Data source: DHB Births and Deaths Projections 2023-43 (2022 Update)
Ageing of Mori Deaths 2023 and 2043 The substantial ageing of projected deaths is a significant strategic challenge for palliative care for M ori wh nau and communities. 21 21 Data source: DHB Births and Deaths Projections 2023-43 (2022 Update)
This is a major strategic challenge. Not only will there be more deaths, but the deaths will be at much older ages. 22 22
Deaths at Older Ages Implications for Palliative Care 23 23
Trajectories at the End of Life Peaks +/ age 65 Accidents - early adult years The three characteristic trajectories illustrated are roughly sequential : Cancer - peaking around age 65 Organ failure - about a decade later, around age 75 Frailty and dementia - those who live past their mid-80s. Around age 75 Those who live past 85 Source: Palliative Care Australia (2010). Health System Reform and Care at the End of Life: a Guidance Document. 2010. Canberra: Palliative Care Australia. Diagram from Lynn, J., & Adamson, D. M. (2003). Living Well at the End of Life. Adapting Health Care to Serious Chronic Illness in Old Age. 2003. RAND Health. 24 24
Independent Life Expectancy New Zealand Study 1996 2013 Female New Zealander at 65 years of age in 2013 can expect to live: another 10.6 years independently, on average, which is 49.5% of her remaining life a further 10.7 years with functional limitations requiring assistance non-daily assistance for 5.9 years daily assistance for final 4.8 years. Male New Zealander at 65 years of age in 2013 can expect to live : another 10.2 years independently, on average, which is 54.1% of his remaining life a further 8.7 years with functional limitations requiring assistance non-daily assistance for 5.6 years daily assistance for the final 3.1 years. Source: Ministry of Health (2015) Independent Life Expectancy in New Zealand, 2013. 25 25
The Trajectories Study 2015 Intend to update and expand this study to 2015-2019 Trajectory Groups allocated sequentially: Dementia, Cancer (diagnosed cancer, died of neoplasm), Chronic Disease (needing ARC or interRAI assessment for home care), Need and Maximal Need (including Disability Support Services), Other Sudden Deaths. Data Source: Trajectories Project, linked data for deaths in New Zealand in 2015 26 26
The Changing Nature of Deaths We used to die at the end of the first decade following retirement. Fairly worn out, but quite happy. Researchers call this the third age. Now we may live and extra decade, two, or even three. Typically with withering health and independence after some kind of accident, usually a fall. May be hospitalised or cared for for weeks or months. This is the fourth age. [Y]ou will be very frail, possibly doubly incontinent, your sight, your taste, your hearing, your ability to orient yourself in time and space may all be severely compromised. You may be experiencing a lot of physical as well as emotional pain. What does palliative care look like when you are 90 and frail and have dementia? Sources:Prof Tony Walter The Revival of Death: two decades on ; Jana Kralova, Living longer , is that good news? University of Bath, GW4 Dying Well Network. https://gw4dyingwell.wordpress.com/ 27 27
Last Year of Life by Trajectory Group Daily place of care for each day in the last year of life (LYOL) for each of the five trajectory groups. Shown as a daily percentage of each group. Data Source: Trajectories Project, linked data for deaths in New Zealand in 2015 28 28
Place of Death by Age Bands Updated Evidence MORT 2000-2018 29 29
Cause of Death This characteristic shapes by age have been known since the first study (2000-2010). In this 2000- 2018 study, have separated out respiratory system deaths so that they can be compared to COVID deaths in later studies. Expecting a decline in respiratory system deaths in 2020 and 2021 lockdown, and then a partial replacement and overtaken by COVID deaths in 2022. 30 30 Data Source: MORT Study 2000-2018
Need and Maximal Need for Palliative Care This puts NZ Minimal Need and NZ Maximal Need together by age band and gender. NZ Minimal Need (with the public hospital adjustment for Circulatory) should be considered the lower bound of the Need for Palliative Care. NZ Maximal Need is the upper bound of the Need for Palliative Care. There is a strong pattern for both by age and gender. 31 31 Data Source: MORT Study 2000-2018
Place of Death by Age and Gender All Causes of Death There is a strong and persistent pattern by age and gender for the place of death. Public hospital declines at older ages, with an expanding green funnel in residential care. 32 32 Data Source: MORT Study 2000-2018
In-patient Bed by Age and Gender All Causes of Death There is a strong and persistent pattern by age and gender for the use of an in-patient bed (public hospital or residential care or hospice IPU) at the end of life. 33 33 Data Source: MORT Study 2000-2018
In-patient Bed by Age and Gender NZ Need for Palliative Care The use of an in-patient bed becomes more spoon-shaped when only the deaths in the Need for Palliative Care are considered. 34 34 Data Source: MORT Study 2000-2018
Place of Death by Age and Gender NZ Need for Palliative Care The shapes change when only the deaths in the Need for Palliative Care are considered. Other settings are low for women and there is a greater proportion of hospice use in the breast cancer years. Residential care now includes some younger deaths. 35 35 Data Source: MORT Study 2000-2018
Place of Death by Age Band Cause of Need for Palliative Care Comparing place of death for neoplasms and all other causes of death in the Need for Palliative Care. There are very different shapes by age, with much greater use of public hospital on the right. 36 36 Data Source: MORT Study 2000-2018
Trends in the Place of Death Updated Evidence MORT 2000-2018 37 37
Place of Death in New Zealand Male Deaths, 2000-2018 Residential care has become an important place of death over the period, surpassing private residence in 2011 and tracking close to the level of deaths in public hospital since 2015. Includes all causes of death. 38 38 Data Source: MORT Study 2000-2018
Place of Death in New Zealand Female Deaths, 2000-2018 Since 2001, residential care has been the most likely place of death for New Zealand women (all causes of death). The gap between residential care and public hospital continues to widen. 39 39 Data Source: MORT Study 2000-2018
Place of Death in New Zealand Neoplasms, 2000-2018 Residential care has become an increasingly important setting for deaths from cancer, overtaking public hospitals in 2010 and tracking higher than private residence since 2015. 40 40 Data Source: MORT Study 2000-2018
The trend to increased numbers of deaths in residential care has been a key feature of the last twenty years. Residential care has long been the most likely place of death for New Zealand women but is now also the most likely place of death for those with cancer. It is close to becoming the most likely place of death for men (across all ages and causes of death). 41
Place of Death All Other Palliative Care For all other causes of death in the Need for Palliative Care, there has been a strong and sustained divergence between public hospital and residential care in all four regions ( crocodile jaws ). Central and Te Waipounamu have the widest divergence over time, with declining public hospital. All regions beginning to see an increase in private residence as place of death. 42 42 Data Source: MORT Study 2000-2018
Place of Death Neoplasms Hospice IPU as place of death for neoplasms varies substantially by region. Te Manawa Taki developed hospice IPU beds later than the other regions. Te Manawa Taki and Te Waipounamu have reducing use of public hospitals. All regions using residential care more heavily in the later years, with use greatest for Te Waipounamu. 43 43 Data Source: MORT Study 2000-2018
Large regional differences in place of death, particularly for cancer. 44 44
Licensed Beds by Region There has been an increase in beds across all regions, with the increase largely in aged care beds. Warning: these are licensed beds and not available or staffed beds. 45 45 Data Source: Manat Hauora Licensed Beds, 2014, 2018, 2023
Hospice Community Care and IPU by Region More community care More IPU There are different models of hospice care. Te Manawa Taki tends to use mostly community care, while Central has and uses more IPU beds. There could also be a rural-urban effect. Some Manawa Taki hospices do have IPU admissions, but to beds in other facilities, e.g. beds in Gisborne public hospital. 46 46 Source: Trajectories Project, linked data for deaths in Aotearoa in 2015
Mori Place of Death MORT 2000-2018 47 47
Place of Death in New Zealand M ori, Pacific, Asian Neoplasms, 2000-2018 Considering deaths from Neoplasms only, private residence, is significantly more likely as a place of death for M ori. Private residence exceeds public hospital for Pacific but is the reverse for Asian. Increases in hospice IPU for all groups, with similar levels in residential care. 48 48 Data Source: MORT Study 2000-2018
Mori Place of Death by Region, Neoplasms Central makes most use of hospice IPU. Te Manawa Taki has a more community-based model of care and hospice IPU beds were developed during the period. In all regions, M ori make more use of private residence and less use of residential care. 49 49 Data Source: MORT Study 2000-2018
Mori Place of Death by Region, Other Need In all regions, M ori make more use of private residence, more use of public hospital, and less use of residential care. 50 50 Data Source: MORT Study 2000-2018
