Understanding Supply and Demand Fundamentals
Explore the fundamental principles of supply and demand, including the laws, concepts, curves, and their impact on market equilibrium. Learn about demand schedules, supply curves, and more.

Download Presentation

Please find below an Image/Link to download the presentation.
The content on the website is provided AS IS for your information and personal use only. It may not be sold, licensed, or shared on other websites without obtaining consent from the author. If you encounter any issues during the download, it is possible that the publisher has removed the file from their server.
You are allowed to download the files provided on this website for personal or commercial use, subject to the condition that they are used lawfully. All files are the property of their respective owners.
The content on the website is provided AS IS for your information and personal use only. It may not be sold, licensed, or shared on other websites without obtaining consent from the author.
E N D
Presentation Transcript
Key Questions What is the Law of Demand? How do we distinguish a change in quantity demanded from a change in demand? What are demand shifters? What is the Law of Supply? How do we distinguish a change in quantity supplied from a change in supply? What are supply shifters? How does the market achieve equilibrium? What do we mean by a surplus and a shortage? How do changes in demand and supply affect market equilibrium? 2
Basics of Demand Demand - the amount of a good or service consumers are willing and able to purchase at each price. Price - what a buyer pays for a unit of the specific good or service. Quantity demanded - the total number of units of a good or service consumers are willing to purchase at a given price Law of demand - keeping all other variables that affect demand constant, an increase in price leads a decrease in quantity demanded, and a decrease in price leads to an increase in quantity demanded. 3
Demand Schedule and Curve The demand schedule - a table that shows a range of prices for a certain good or service and the quantity demanded at each price. The demand curve - a graphic representation of the relationship between price and quantity demanded of a certain good or service, with quantity on the horizontal axis and the price on the vertical axis. 4
Price and Quantity Demanded Along a Demand Curve When the points of a demand schedule are graphed, the line connecting them is the demand curve (D). The downward slope of the demand curve illustrates the law of demand - the inverse relationship between price and quantity demanded, ceteris paribus. 5
Basics of Supply Supply - the amount of some good or service a producer is willing to supply at each price. Quantity supplied - the total number of units of a good or service producers are willing to sell at a given price. Law of supply - assuming all other variables that affect supply are held constant, an increase in price leads to an increase in quantity supplied, and a decrease in price leads to a decrease in quantity supplied. 6
Define a Supply Schedule and the Supply Curve The supply schedule - a table that shows the quantity supplied at a range of different prices. The supply curve - a graphic illustration of the relationship between price, shown on the vertical axis, and quantity, shown on the horizontal axis. 7
Price and Quantity Supplied Along a Supply Curve The supply curve is created by graphing the points from a supply schedule. The upward (positive) slope of the supply curve illustrates the law of supply - that a higher price leads to a higher quantity supplied and vice versa, ceteris paribus. 8
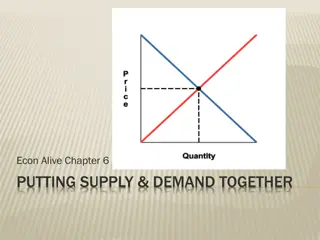
Market Equilibrium: Where Demand and Supply Intersect Equilibrium - the combination of price and quantity where there is no economic pressure from surpluses or shortages that would cause price or quantity to change quantity demanded = quantity supplied Equilibrium price - the price where quantity demanded is equal to quantity supplied Equilibrium quantity - the quantity at which quantity demanded and quantity supplied are equal for a certain price level. 9
Graphing Market Equilibrium The demand curve (D) and the supply curve (S) intersect at the equilibrium point E. The equilibrium price is the only price at which quantity demanded = quantity supplied At a price above equilibrium, quantity supplied > quantity demanded, so there is excess supply. At a price below equilibrium, quantity demanded > quantity supplied, so there is excess demand. 10
Change in Quantity Demanded Movement Along the Demand Curve Any given demand curve is based on the ceteris paribus assumption (the assumption that all else is held equal). A Change in Quantity Demanded - Along a demand curve, a price change, ceteris paribus, leads to a change in quantity demanded. The consumer moves from one point on a demand curve to another point on the same demand curve. 11
Change in Demand A Shift in the Demand Curve Increased demand means that at every given price, the quantity demanded is higher, so that the demand curve shifts to the right from D0 to D1. Decreased demand means that at every given price, the quantity demanded is lower, so that the demand curve shifts to the left from D0 to D2. 12
What Factors Shift a Demand Curve? A shift in demand happens when a change in some economic factor (other than price) causes a different quantity to be demanded at every price. Factors that affect demand: Income Changing tastes or preferences Changes in the composition of the population Price of substitute or complement changes Changes in expectations about future 13
How Changes in Factors Other Than Price Shift the Demand Curve Panel (a): A list of factors that can cause an increase in demand from D0 to D1. Panel (b): The same factors, if their direction is reversed, can cause a decrease in demand from D0 to D1. 14
Classifying Goods and Services With respect to change in income: Normal good - A product whose demand rises when income rises, and vice versa. Inferior good - A product whose demand falls when income rises, rises, and vice versa. With respect to changes in the prices of other goods: Substitute - a good or service that we can use in place of another good or service. Complements - goods or services that are often used together so that consumption of one good tends to enhance consumption of the other. 15
Change in Quantity Supplied Movement Along the Supply Curve Any given supply curve is based on the ceteris paribus assumption. A Change in Quantity Supplied Along a supply curve, a price change, ceteris paribus, leads to a change in quantity supplied. The seller moves from one point on a supply curve to another point on the same supply curve. 16
Change in Supply A Shift in the Supply Curve Decreased supply means that at every given price, the quantity supplied is lower, so that the supply curve shifts to the left, from S0 to S1. Increased supply means that at every given price, the quantity supplied is higher, so that the supply curve shifts to the right, from S0 to S2. 17
What Factors Shift a Supply Curve? A shift in supply happens when a change in some economic factor (other than price) causes a different quantity to be supplied at every price. Inputs or factors of production - the combination of labor, materials, and machinery that is used to produce goods and services. Factors that affect supply: Natural conditions Input prices Technology Government policies 18
How Changes in Factors Other Than Price Shift the Supply Curve Panel (a): A list of factors that can cause an increase in supply from S0 to S1. Panel (b): The same factors, if their direction is reversed, can cause a decrease in supply from S0 to S1. 19
Changes in Equilibrium Price and Quantity: The Four-Step Process The four-step process to determining how an economic event affects equilibrium price and quantity: Step 1. Draw a demand and supply model before the economic event took place. Step 2. Decide whether the economic event affects demand or supply. Step 3. Decide whether the event causes a curve shift to the right or to the left, and sketch the new curve on the diagram. Step 4. Identify the new equilibrium and then compare to the original. 20
Example: Shift in Supply Question: Using the 4-step approach, how did excellent weather conditions during the summer affect the quantity and price of salmon? 21
Example: Shift in Demand Question: From 2004 to 2012, the share of Americans who reported obtaining their news from digital sources increased from 24% to 39%. Using the 4- step approach, how has this affected the consumption of traditional sources, such as print news media, and radio and television news? 22
A Combined Example Question: Using the 4-step approach, what does an increase in labor compensation, as well as an increase in digital communication suggest about the continued viability of the Postal Service? 23
Price Ceilings and Price Floors Price controls - laws that governments enact to regulate prices. Price ceiling keeps a price from rising above a certain level. a legal maximum price that one pays for some good or service. Price floor keeps a price from falling below a given level. is the lowest price that one can legally pay for some good or service. 24
A Price Ceiling Example Rent Control The original intersection of demand and supply occurs at E0. If demand shifts from D0 to D1, the new equilibrium would be at E1 - unless a price ceiling prevents the price from rising. If the price is not permitted to rise, the quantity supplied remains at 15,000. However, after the change in demand, the quantity demanded rises to 19,000, resulting in a shortage. 25
A Price Floor Example European Wheat Prices The intersection of demand (D) and supply (S) would be at the equilibrium point E0. However, a price floor set at Pf holds the price above E0 and prevents it from falling. The result of the price floor is that the quantity supplied Qs exceeds the quantity demanded Qd. There is excess supply, also called a surplus. 26