The VLA Sky Survey and Its Scientific Goals
The VLA Sky Survey (VLASS) is a comprehensive radio survey covering the sky visible to the VLA, conducted in three epochs with a focus on imaging galaxies, detecting transient events, exploring Faraday tomography, and uncovering hidden phenomena in the universe. The survey employs innovative strategies like on-the-fly mosaicking and includes commensal survey programs to enhance its coverage and capabilities. With its ambitious goals and advanced techniques, VLASS aims to revolutionize our understanding of the cosmos.

Download Presentation

Please find below an Image/Link to download the presentation.
The content on the website is provided AS IS for your information and personal use only. It may not be sold, licensed, or shared on other websites without obtaining consent from the author.If you encounter any issues during the download, it is possible that the publisher has removed the file from their server.
You are allowed to download the files provided on this website for personal or commercial use, subject to the condition that they are used lawfully. All files are the property of their respective owners.
The content on the website is provided AS IS for your information and personal use only. It may not be sold, licensed, or shared on other websites without obtaining consent from the author.
E N D
Presentation Transcript
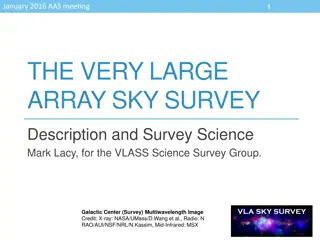
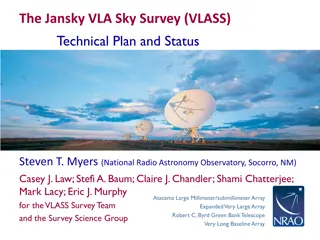
Mark Lacy, VLASS Project Scientist. On behalf of the VLASS Project and Survey Science Group AAS January 2017 1
What is the VLA Sky Survey? All the sky the VLA can see (Dec >-40). Three epochs, each epoch separated by 32 months. S-band (2-4GHz), IQU polarization. Depth 120 Jy per epoch, 70 Jy combined. 2.5 resolution better than any previous large area radio survey. Pilot survey observations were executed in the Summer of 2016. Observations of the full survey started in September 2017. Observation of the 3rdepoch will be completed in 2024, completing ~5520hr of observing. AAS January 2017 2
Science Goals Imaging galaxies through time and space Hidden explosions (transient events: SNe, tidal disruption events, GRBs..) Faraday tomography of the magnetic sky The Milky Way Missing Physics Serendipitous discoveries that come from opening up new parts of observational parameter space. AAS January 2017 3
FIRST VLASS NVSS VLASS+SDSS AAS January 2017 5
Transients AAS January 2017 6
Survey Strategy On the Fly mosaiking is used the antennas scan continuously in a raster pattern in RA and Dec in large (40-80 deg2) tiles . Data are sampled every 0.45s, ~10 samples across the beam. The sky is divided into 40deg2 tiles typically tiles are paired in Scheduling Blocks to give blocks of 4hr duration, enough time for the polarization leakage calibrator to cover 90 deg in parallactic angle. The 4hr SBs are short enough to work into the dynamic schedule, and thus minimize the impact on PI science. AAS January 2017 8
Commensal surveys Two survey programs will run in parallel with VLASS: Realfast (PI C. Law) is a fast transient survey that uses a fast-sampled data stream from the VLA correlator to search for fast transients in real time. VLITE (PI T. Clarke) uses the VLA low- band receivers (at prime focus) to observe commensally at 320-384MHz with the high frequency Cass feeds that are used for the main survey. Both these systems run at the VLA in any case, but the VLASS observations are perfect for increasing their programs to all-sky coverage. AAS January 2017 10
VLASS progress VLASS will be taken in three epochs, observing half the sky in each B-array configuration over a seven year period (ending in 2024). Additionally, a pilot survey was carried out during the Summer of 2016. The first half of the first epoch of the full survey will be completed in February 2018. AAS January 2017 11
VLASS Epoch 1, pass 1 (VLASS1.1) Ongoing now. Observing half the sky, including pilot areas. B-array observations started in September 2017. Moving to hybrid BnA in January 2018 to observe southern sky. AAS January 2017 14
VLASS data Images from https://archive-new.nrao.edu/vlass/quicklook/ See also (unofficial) Aladin-Lite viewer: http://www.aoc.nrao.edu/~smyers/vlass/VLASS1.1/pubimages/ALLPNG/ AAS January 2017 15
Source counts Most sources are resolved in the 2.5 beam AAS January 2017 16
Spectral indices The octave-wide bandwidth allows spectral index estimates either from cubes or from the ratio of the 1st and 0th Taylor-term images. Works well at high S:N. AAS January 2017 17
Polarimetry Comparing to NVSS, mean polarization similar. See a lot more structure in the RM that is washed out in the low resolution NVSS data. Images courtesy of L. Rudnick AAS January 2017 18
Lessons learned from the pilot and first pass Inevitably, we learned a lot . Data compression due to high levels of RFI Have a solution for the less severe cases. Scheduling is very difficult, particularly with queue scheduling combined with the need for parallactic angle coverage for polarization calibration and constraints from geostationary satellites near the equator. AAS January 2017 19
Lessons learned -2 Ghost images If data is assigned by the software to the wrong scan, it can lead to ghost images in the OTF mapping. Luckily easy to identify as they are almost exactly 3 in RA from the original. Also very rare (~0.03% of sources). Working on flagging these in the UV data. 180 arcsec AAS January 2017 20
All images are 2 arcminutes, produced with the VLA quick look imaging pipeline. B. Kent and the VLASS team AAS January 2017 21
Next steps Single epoch imaging Quicklook images produced so far are in Stokes I only and coarsely sampled Over the next year, we will make Single Epoch images, which will be better sampled, and utilize improved imaging algorithms. Full Stokes cubes with 128MHz channels will be produced, and about 10% of the sky around bright sources (all we can afford to store), will be archived at NRAO. Cubes will be stored as planes, users will download the planes for a given cube and use a CASA script to assemble into a cube. Means we can easily deal with varying beams as a function of frequency AAS January 2017 22
Cumulative imaging. Once more than one epoch is complete over the whole sky we will coadd the epochs. Cumulative products will be similar to the Single Epoch ones, but deeper. Will also include fine cubes around very bright sources (16MHz channels) and spectral curvature images. If developed in time, algorithms to deal correctly with sources that vary between epochs (breaking the stationary sky assumption of imaging) will be implemented. AAS January 2017 23
Enhanced Data Products NRAO does not have the resources to fully exploit the VLASS dataset We are therefore collaborating with external groups to produce enhanced data products. These are likely to include: Transient Object Catalogs and Alerts Rotation measure images and catalogs Full spectral resolution image cubes Light curves for variable sources Improved catalogs, with multiwavelength associations. Collaborators include the Canadian CIRADA program (funded through CFI) and the South African IDIA program. AAS January 2017 25
How to get involved: VLASS has been community led from the start this is your survey! If you are interested in getting involved, the Science Working Groups are always open to new members, follow the link to the Google Group on https://science.nrao.edu/science/surveys/vlass AAS January 2017 26
VLASS related presentations at AAS 231 Oral: 231.02 Radio Transients in 1333 deg2of the VLA Sky Survey Pilot Dillon Dong; Gregg Hallinan; Steven T. Myers; Kunal Mooley Oral: 231.08. The VLA Sky Survey (VLASS): Overview and First Results Steven T. Myers Poster: 342.14. The Very Large Array Data Processing Pipeline Brian R. Kent; Joseph S. Masters; Claire J. Chandler; Lindsey E. Davis; Jeffrey S. Kern; Juergen Ott; Frank K. Schinzel; Drew Medlin; Dirk Muders; Stewart Williams; Vincent C. Geers; Emmanuel Momjian; Bryan J. Butler; Takeshi Nakazato; Kanako Sugimoto Poster: 342.30. VLITE Surveys the Sky: A 340 MHz Companion to the VLA Sky Survey (VLASS) Wendy Peters; Tracy Clarke; Walter Brisken; William Cotton; Emily E. Richards; Simona Giacintucci; Namir Kassim AAS January 2017 27
www.nrao.edu science.nrao.edu public.nrao.edu The National Radio Astronomy Observatory is a facility of the National Science Foundation operated under cooperative agreement by Associated Universities, Inc. AAS January 2017 28


")