California Public Libraries Survey 2020-2021 Overview
The California Public Libraries Survey for 2020-2021 provides an in-depth look at the state of libraries in California. This webinar covers the survey process, data elements, resources, and the importance of the survey in understanding and meeting community needs. Learn about the National Public Libraries Survey, who uses the data, and key dates for reporting data from July 1, 2020, to June 30, 2021. Don't miss out on essential information on directory and administrative details, including the impact of COVID-19 on library services. Get ready to participate in the survey and contribute to the library community.
Download Presentation

Please find below an Image/Link to download the presentation.
The content on the website is provided AS IS for your information and personal use only. It may not be sold, licensed, or shared on other websites without obtaining consent from the author.If you encounter any issues during the download, it is possible that the publisher has removed the file from their server.
You are allowed to download the files provided on this website for personal or commercial use, subject to the condition that they are used lawfully. All files are the property of their respective owners.
The content on the website is provided AS IS for your information and personal use only. It may not be sold, licensed, or shared on other websites without obtaining consent from the author.
E N D
Presentation Transcript
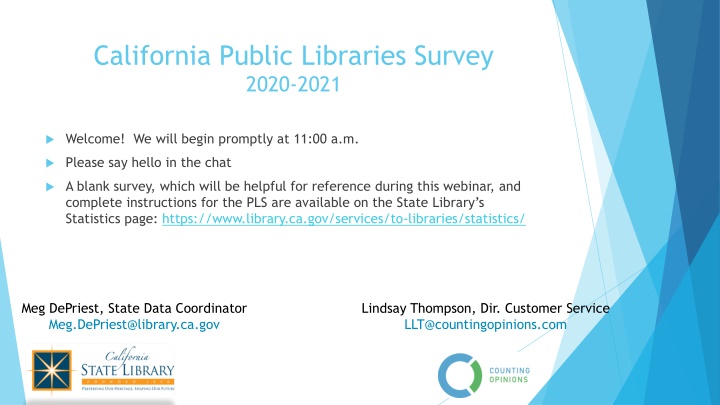
California Public Libraries Survey 2020-2021 Welcome! We will begin promptly at 11:00 a.m. Please say hello in the chat A blank survey, which will be helpful for reference during this webinar, and complete instructions for the PLS are available on the State Library s Statistics page: https://www.library.ca.gov/services/to-libraries/statistics/ Meg DePriest, State Data Coordinator Meg.DePriest@library.ca.gov Lindsay Thompson, Dir. Customer Service LLT@countingopinions.com
What year is it? Ernio Hernandez Artist @ernio_art
Agenda What is the PLS and why do we do it each year? Review survey please use the chat for questions along the way! New data elements this year Common questions about data elements Resources and where to find them Introduction/Review of LibPAS Logging in Navigating Completing and printing Questions
The National Public Libraries Survey Conducted each year since 1988 9,000 libraries (17,000 main, branch and mobile libraries) Backbone of research analysis, and discussion of the current state of libraries Demonstrates how libraries respond to changing needs of communities https://www.imls.gov/research-evaluation/data-collection/public-libraries-survey
Who uses the data? IMLS Libraries and library organizations Researchers Journalists Policy Makers The Public
California Public Library Survey 2020-2021 Reporting data from July 1, 2020-June 30, 2021 Survey will open September 7, 2021 and close November 5, 2021 Username and passwords will be emailed on September 7.
Section 1 Directory and Administrative Information Greyed out areas are CSL only. Contact Meg or Lindsay with any changes Section 1a. COVID-19 Yes/No questions Fewer questions this year Help give context to significant changes in data this year Helps demonstrate libraries services while building access was restricted New: Deputy Director s name and email for CSL communications
Section 2 Population and Outlets Population of library service area. Population figures are obtained from the Department of Finance http://www.dof.ca.gov/Forecasting/Demographics/Estimates/E-1/ If you believe there is an error, please contact Meg DePriest Number of outlets is automatically calculated; sum of central and branches Total square footage automatically calculated from data entered in Section 10: Outlets.
Sections 3 and 4 Library Income and Expenses 3.2 State funds are literacy, Shared Vision, and broadband grants 3.3 Federal funds are LSTA, ARPA, and CARES funds and CopyCat grants If there is a significant difference, please make a note using the notepad symbol to the left of the data entry box Between this year s and last year s numbers, especially Capital Expenses and Income Between 3.5 Total Operating Income and 4.11 Total Operating Expenditures
Section 5 Library Staff 5.1 Total count of persons employed is counting PEOPLE 5.5 Total FTE is counting HOURS Sum the total number of hours worked for each employee Divide by 40 (40 hours/week = 1 FTE) if counting per week Divide by 2080 (2080 hours/year = 1 FTE) if counting per year (good for seasonal employees) 5.2 vs. 5.3 ALA accredited librarians vs. all librarians 5.5 Total staff FTE is automatically calculated; sum of 5.3 all librarians & 5.4 all other staff 9 Total Librarians 5 ALA Librarians
Section 5 Library Staff, part 2 The Salary Survey is back! (data collected every three years) Salary range: report beginning step and final step of monthly salary range Please compute monthly payments if HR does not provide monthly. (divide yearly by 12, for example) If your library has more than one class of a position, report the higher salary. Ten positions in the survey: you will not be able to report all positions. Use your best judgement in matching your library s job titles to the survey s titles
Section 6 Library Collections New this year: 6.6 Other Physical Items Hotspots, cake pans, tools, laptops, bicycles Electronic resources-What Goes Where? You can download this flow chart from the state library statistics page. 6.13 Electronic Collections (databases) through state funding, no more than six for FY20-21 Archives Unbound Brainfuse Britannica New York Times ProQuest TeachingBooks
Section 7 Library Services 7.1 Hours open is an automatic sum of data entered in Section 9 & 10: Outlets 7.6 New this year: Late Fines Y/N and amount charged for children, YA, adults 7.10 New this year: Laptop lending Y/N 7.11 New this year: Hotspot lending Y/N
Section 7 Library Services - Programming Count all participants, for example children and caregivers at a storytime When multiple ages are present, chose the age category that best represents the program New and optional this year, required next year: General interest programming Appropriate for any or all age groups, for families, intergenerational Optional this year, but required next year: separate out virtual, live programming Answer the question Are you able to report in-person and live, virtual programming separately for all categories and form will adjust New and optional this year, required next year Early learning (age 0-5) Children (6-11)
Section 7 Library Services Programming, part 2 Change in instructions for counting views of recorded programming Count of views of previously-recorded program presentations for a period of seven (7) days after the presentation was posted Don t worry! This will be required next year. If you cannot report at seven days, report what you have and make a note. New this year: Self Directed Activities Count each activity that is offered only once, even if you make 20 copies of it. Number of participants: approximate is the best you can do!
Sections 9 & 10 Bookmobiles and Outlets Number of weeks closed to the public Closed means members of the public can not access the building/vehicle Staff access may occur, but if public cannot enter, building/vehicle is closed. Curbside service may occur, but building/vehicle is still closed if public cannot access Number of weeks with limited occupancy reduction in number of visitors reduced hours appointment only service visitor time limits closed stacks or meeting rooms
Resources as you complete the survey Library.ca.gov/services/to-libraries/statistics Blank survey in excel Instructions they are long, but they answer almost all of your questions! Counting Electronic Items flowchart Link to Ready Reports where you can view previous years data summaries CaCountingOpinions.com Data entry portal Links to the resources above Meg DePriest, State Data Coordinator I M HERE TO HELP! Meg.DePriest@library.ca.gov 916.508.1350
LibPAS Data Input Training Logging in who to contact for help Navigating the survey tool LibPAS functionality, layout, and structure Completing the survey - required information, repeating fields, and notes Printing and saving your survey Submitting the survey and dealing with edit checks
Login / Access Web Address: https://ca.countingopinions.com/ System Requirements: Mac and Windows operating systems supported All major browsers are OK; newest versions recommended
Submitting Survey If, after selecting the Submit/Lock button the buttons disappear and are replaced by the Locked image below, then your survey has been submitted successfully! If, after selecting the Submit/Lock button you see a pop-up that reads Lock Failed and provides a list of required fields or edits that require an explanation, you re not quite done. Please address the fields and try again.
Questions? Meg DePriest meg.depriest@library.ca.gov 916-508-1350 Lindsay Thompson llt@countingopinions.com 800-521-4930 This webinar is supported in whole or in part by the U.S. Institute of Museum and Library Services under the provisions of the Library Services and Technology Act, administered in California by the State Librarian.
