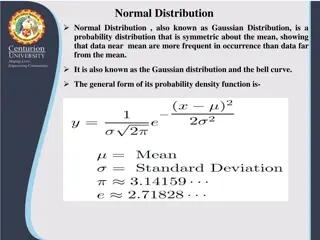
Normal Curve in Data Analysis
Chapter 3b
(Normal Curves)
•
When is a data point ( raw score) considered
unusual?
Chapter 3b
(Normal Curves)
•
In Chapter 3- We have 3 “tasks”
1)
Find the “Z Score” of a raw score “x”
(where x is “normally distributed”)
2) Find the ‘relative position” of a raw score “x”
in terms of it’s “percentile” score
3)
(Given a
“word problem”
) , make a
conclusion about the relative position of “x” – or --
find the raw score “x” needed to satisfy some
condition
Chapter 3b– Some Definitions
Z Score :
A measure of the relative position of a data point
when the population is “approximately normally” distributed
z is
the number of standard deviations
and the direction a “raw score” is away
from the population’s mean.
Eg. Given
X ~ N( 27,5)
Then if x=36 , z=
1.8
Z Table
–
a list giving the proportion of scores
below
a
specific z score. In this text, it is called: Table A, Standard
Normal Probabilities.
Here is a histogram of vocabulary scores of 947 seventh graders
.
What is the z score for a raw score of 10 ? Answer :
z
=
What is the z score for a raw score of 5 ? Answer ; z=
Your Turn : given
What is a child’s z score, if
her vocabulary score was 4 ?
What is a “standardized” score
for a vocabulary score of 12?
Would you consider a vocab
score of 9 unusual?
X~N(3.8, 4.3)
Find the z score for a value of 9. Is 9 an “unusual score” ?
Z= = ( 9-3.8)/4.3 = 1.21 for some people “yes” others “no”
For some people, anything over 1
is “unusual”. For others , they only
think in “Percentile score” ---so lets find a percentile !
Task #2: Finding the ‘relative position” of a raw
score “x” in terms of it’s “percentile” score
P(X
<
x
score
)
the “proportion” of data points less then or
equal to a raw score “x” . If given in %, it is
often referred to as the
“percentile”
score
P(Z
<
z
score
)
the “proportion” of standardized points less than
or equal to the or equal to the “standardized”
score “z”.
Then we will use Table A to find the “proportion” of scores “less than”
IQ ~N(100,15)
•
P(x<122) = ? What proportion of scores are below an IQ
of 122 .
P(x<122)= = P(z< 1.47)
•
Using Table A, the proportion of data points
below
z=1.47 is 0.9292
“ An IQ of 122 puts an individual in the 92.92 percentile “
IQ ~N(100,15)
•
P(x<82) = ? What proportion of scores are below an IQ
of 82 .
Your turn
IQ ~N(100,15)
•
P(x>82) = ? What proportion of scores are above an IQ
of 82 .
CAUTION: Table A “only” gives probabilities/proportions ‘below” a specified
z score
A”twist” on the wording
IQ ~N(100,15)
•
P(x>82) = ? What proportion of scores are above an IQ f 82 .
“FROM definition of density curves” “ P(x>82) = 1-P(x
<
82)
P(x>82) = P(z>-1.20) = 1-P(z
<
-1.20) = 1-.1151 = 0.8849
ALTERNATIVE : use of Table A –due to symmetry
P(z >#) = P(z<-#) so P( z >-1.20) = P(z<+1.20) = .8849
A”twist” on the wording
ANSWER:
Your Turn
Given that female heights (in inches) are
distributed approximately : x ~N(64,2.7) .
1. What proportion of females are below 60”?
2. What is the probability of randomly selecting
a female who is taller than 70” ?
P( 80 < x<110)
•
This is equivalent to finding P(x<120) – P(x<80)
•
P(z<0.67) –P(z<-1.33) = .7486 - .0918 = .6568
*Note: You are subtracting “Areas” =--never subtract z scores
Your Turn
•
. Given that female heights (in inches) are
distributed approximately : X ~N(64,2.7) .
What proportion of females are between 61”
and 67”
i.e. P( 61 < x< 67) = ?
Finding a z score corresponding to a “percentile”
(using Table A “backwards” )
What z score is “just above” a 70 percentile?
i.e. P(Z<z
score
) = .70 what is z
score
?
Find Table A entry (“inside”) that is closest to
.7000
…… .6985 .7019 ………..
Find the corresponding “z score”
0.52
Chapter 3c – Friday
Finding a “raw score” corresponding to a
“percentile”
(using Table A “backwards” )
First remember : or
Finding a x score is really dependent on finding a ‘z score” first
e.g. Given IQ’s ~N(100,15) what IQ just is in the 90 percentile?
Find “z score” corresponding to a Table A entry closest to .9000
….. .8997 .9015 …….
Z=1.28
X= 100+1.28(15) = 100 +19.2 = 119
Your turn
•
Given female heights (in inches) are
distributed approximately : x ~N(64,2.7) .
What height just puts a female into the
bottom 25% (ie. what is Q1!)
Task #3 – Word Problems
•
Incomes in a local city are approximately normally distributed
with a mean of $36,000 and a standard deviation of $8000
What percentage of incomes are below $30,000?
1) sketch the density curve, labeling the mean, etc appropriately.
2) identify the area under the curve to the left of x = 30,000 (by shading it
in)
3) Calculate the z score for x=30,000 z= _________
4) using Table A find the P(Z < z calculated in step 3 )
“4b”
look at your sketch does your answer make sense?
Task #3 – Word Problems
(continued)
•
Incomes in a local city are approximately normally distributed
with a mean of $36,000 and a standard deviation of $8000
What income is ”just” in the bottom 20% ?
1) sketch the density curve, labeling the mean, etc appropriately.
2) identify the area that is “approximately” in the bottom 20%
3) Find a z score that’s “closest” to .8000
4)
Calculate x score from z score.
“4b”
look at your sketch does your answer make sense?
Your turn
•
WS Ch 3
This overview delves into the concept of normal curves and Z-scores in statistics. Explore how to identify unusual data points, calculate Z-scores, determine percentile scores, and analyze the relative position of raw scores in a normally distributed population. Gain insights into interpreting vocabulary scores, standardized scores, and the proportion of data points below specific values. Discover practical examples and visual aids to deepen your understanding of normal distribution analysis.

Download Presentation

Please find below an Image/Link to download the presentation.
The content on the website is provided AS IS for your information and personal use only. It may not be sold, licensed, or shared on other websites without obtaining consent from the author.If you encounter any issues during the download, it is possible that the publisher has removed the file from their server.
You are allowed to download the files provided on this website for personal or commercial use, subject to the condition that they are used lawfully. All files are the property of their respective owners.
The content on the website is provided AS IS for your information and personal use only. It may not be sold, licensed, or shared on other websites without obtaining consent from the author.
E N D
Presentation Transcript
Chapter 3b (Normal Curves) When is a data point ( raw score) considered unusual?
Chapter 3b (Normal Curves) In Chapter 3- We have 3 tasks 1) Find the Z Score of a raw score x (where x is normally distributed ) 2) Find the relative position of a raw score x in terms of it s percentile score (Given a word problem ) , make a conclusion about the relative position of x or -- find the raw score x needed to satisfy some condition 3)
Chapter 3b Some Definitions Z Score : A measure of the relative position of a data point when the population is approximately normally distributed z is the number of standard deviations and the direction a raw score is away from the population s mean. =x z Eg. Given X ~ N( 27,5) Then if x=36 , z= 1.8 Z Table a list giving the proportion of scores below a specific z score. In this text, it is called: Table A, Standard Normal Probabilities.
Here is a histogram of vocabulary scores of 947 seventh graders. ) 5 . 1 , 7 ( ~ N x What is the z score for a raw score of 10 ? Answer : z= What is the z score for a raw score of 5 ? Answer ; z=
~ N 5 . 1 , 7 ( ) x Your Turn : given What is a child s z score, if her vocabulary score was 4 ? What is a standardized score for a vocabulary score of 12? Would you consider a vocab score of 9 unusual?
X~N(3.8, 4.3) Find the z score for a value of 9. Is 9 an unusual score ? x Z= = ( 9-3.8)/4.3 = 1.21 for some people yes others no For some people, anything over 1 is unusual . For others , they only think in Percentile score ---so lets find a percentile !
Task #2: Finding the relative position of a raw score x in terms of it s percentile score P(X < xscore) the proportion of data points less then or equal to a raw score x . If given in %, it is often referred to as the percentile score P(Z <zscore ) the proportion of standardized points less than or equal to the or equal to the standardized score z . x = = score ( ) ( ) ( ) P X x P Z P Z score z score Then we will use Table A to find the proportion of scores less than
IQ ~N(100,15) of 122 . P(x<122) = ? What proportion of scores are below an IQ 122 100 = ( ) P z P(x<122)= = P(z< 1.47) Using Table A, the proportion of data points below z=1.47 is 0.9292 15 An IQ of 122 puts an individual in the 92.92 percentile
Your turn IQ ~N(100,15) of 82 . P(x<82) = ? What proportion of scores are below an IQ
Atwist on the wording IQ ~N(100,15) of 82 . P(x>82) = ? What proportion of scores are above an IQ CAUTION: Table A only gives probabilities/proportions below a specified z score
Atwist on the wording ANSWER: IQ ~N(100,15) P(x>82) = ? What proportion of scores are above an IQ f 82 . FROM definition of density curves P(x>82) = 1-P(x<82) P(x>82) = P(z>-1.20) = 1-P(z<-1.20) = 1-.1151 = 0.8849 ALTERNATIVE : use of Table A due to symmetry P(z >#) = P(z<-#) so P( z >-1.20) = P(z<+1.20) = .8849
Your Turn Given that female heights (in inches) are distributed approximately : x ~N(64,2.7) . 1. What proportion of females are below 60 ? 2. What is the probability of randomly selecting a female who is taller than 70 ?
P( 80 < x<110) x This is equivalent to finding P(x<120) P(x<80) P(z<0.67) P(z<-1.33) = .7486 - .0918 = .6568 *Note: You are subtracting Areas =--never subtract z scores
Your Turn . Given that female heights (in inches) are distributed approximately : X ~N(64,2.7) . What proportion of females are between 61 and 67 i.e. P( 61 < x< 67) = ?
Finding a z score corresponding to a percentile (using Table A backwards ) What z score is just above a 70 percentile? i.e. P(Z<zscore) = .70 what is zscore ? Find Table A entry ( inside ) that is closest to .7000 .6985 .7019 .. Find the corresponding z score 0.52
Finding a raw score corresponding to a percentile (using Table A backwards ) =x = + z x First remember : or z Finding a x score is really dependent on finding a z score first e.g. Given IQ s ~N(100,15) what IQ just is in the 90 percentile? Find z score corresponding to a Table A entry closest to .9000 .. .8997 .9015 . Z=1.28 X= 100+1.28(15) = 100 +19.2 = 119
Your turn Given female heights (in inches) are distributed approximately : x ~N(64,2.7) . What height just puts a female into the bottom 25% (ie. what is Q1!)
Task #3 Word Problems Incomes in a local city are approximately normally distributed with a mean of $36,000 and a standard deviation of $8000 What percentage of incomes are below $30,000? 1) sketch the density curve, labeling the mean, etc appropriately. 2) identify the area under the curve to the left of x = 30,000 (by shading it in) 3) Calculate the z score for x=30,000 z= _________ 4) using Table A find the P(Z < z calculated in step 3 ) 4b look at your sketch does your answer make sense?
Task #3 Word Problems (continued) Incomes in a local city are approximately normally distributed with a mean of $36,000 and a standard deviation of $8000 What income is just in the bottom 20% ? 1) sketch the density curve, labeling the mean, etc appropriately. 2) identify the area that is approximately in the bottom 20% 3) Find a z score that s closest to .8000 4) Calculate x score from z score. 4b look at your sketch does your answer make sense?
Your turn WS Ch 3
")
")


")

")


")


")