Normal Distribution in Statistics Education
 undefined


Algebra 2 – Statistics
Normal Distribution
Unit 5
Purpose
Provided is a lesson for teachers to use to help students understand
and analyze normal distribution. Included are the following:
Common Core Standards
S-ID.4.
Use the mean and standard
deviation of a data set to fit it to a normal
distribution and to estimate population
percentages. Recognize that there are
data sets for which such a procedure is
not appropriate. Use calculators,
spreadsheets, and tables to estimate
areas under the normal curve.
(Apply, 2)
(Remember, 1)
(Apply, 2)
Math Practices
Statistics & Probability
Prerequisite Skills: CC Math 6-8
http://commoncoretools.me/wp-content/uploads/2012/06/ccss_progression_sp_hs_2012_04_21_bis.pdf
Grade 6
O
Develop
understandi
ng of
statistical
variability.
O
Summarize
and
describe
distributions.
Grade 7
O
Use random
sampling
to draw
inferences about a
population.
O
Draw informal
comparative
inferences
about
two populations.
O
Investigate chance
processes and
develop, use, and
evaluate probability
models.
Grade 8
Investigate
patterns of
association in
bivariate data.
Source: California Framework
Algebra I
Summarize,
represent, and
interpret data on a
single count or
measurement
variable.
Summarize,
represent, and
interpret data on
two
categorical and
quantitative
variables.
Interpret linear
models.
Geometry
Conditional Probability
and the Rules of
Probability
Understand
independence
and conditional probability
and use them to interpret
data.
Use the rules of probability
to compute probabilities of
compound events
in a
uniform probability model.
Using Probability to Make
Decisions
Use probability
to
evaluate outcomes of
decisions
Algebra II
Interpreting Categorical
and Quantitative Data
Summarize, represent,
and interpret data on a
single count or
measurement variable.
Making Inferences and
Justifying Conclusions
Understand and evaluate
random processes
underlying statistical
experiments.
Make inferences and
justify conclusions
from
sample surveys,
experiments, and
observational studies.
Using Probability to Make
Decisions
Use probability
to
evaluate outcomes of
decisions.
Source: California Framework
Learning Progression:
HS Statistics & Probability
http://commoncoretools.me/wp-content/uploads/2012/06/ccss_progression_sp_hs_2012_04_21_bis.pdf
Lesson Agenda
O
Vocabulary
O
Video:
O
Lesson:
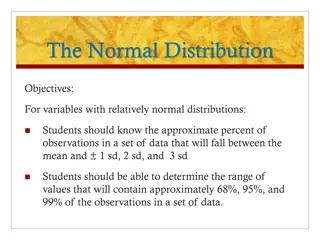
Understand the properties of normal
distribution and identify situations that can be
modeled by a normal distribution curve by
examining distributions of one-variable
distribution sets
O
Textbook Connections
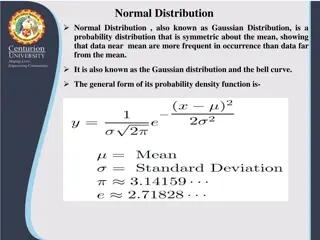
Normal Distribution
Planning for Instruction with
understanding Normal Distribution
Getting Ready
O
Pre-assessment- used to determine understanding of
prerequisite skills
O
Prerequisite skills include
O
6.SP 2-3
O
Understand that a set of data collected to answer a
statistical question has a distribution which can be
described by its center, spread, and overall shape.
O
Recognize that a measure of center for a numerical data set
summarizes all of its values with a single number, while a
measure of variation describes how its values vary with a
single number
O
6.SP 5
O
Summarize numerical data sets in relation to their context
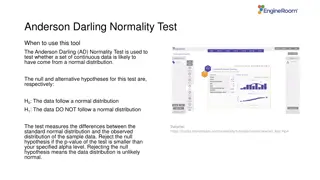
Misconceptions and Anticipated
Issues
Common Issues
a.
Using the wrong total from
the frequency table
b.
Misunderstanding the
graph
c.
Wrong interpretation of
mean or median
d.
Incorrect calculations for
standard deviation
Suggested Strategies/Resources
a.
Use the additional
practice worksheets from
learnzilllion lesson
b.
Use more than 1
vocabulary organizer to
address key vocabulary
c.
Allow students to use a
calculator
d.
Analyze the graph and
understand the standard
variation vs mean
Required Resources
Materials Required
Handouts:
O
Learnzillion presentation handouts
O
Learnzillion additional worksheets
O
https://learnzillion.com/lesson_plans/417
Needed Vocabulary
O
Normal Distribution
O
Data
O
Standard Deviation
O
Statistics
O
Median
O
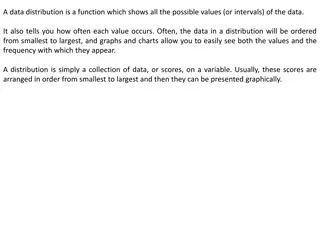
Data Distribution
Or you could
use: Layered
book, Frayer’s
Model etc.
Learnzillion
For this lesson you need to create an account
to access the handouts from Learnzillion.
This is a free account and you will have access
to many more lessons.
Normal Distribution
https://learnzillion.com/lesson_plans/417
Planning and Time
Textbook Connection
Big Ideas
O
Textbook Algebra 2 Section 11.1
O
Classwork: Page 600 problems 1 – 6
O
Homework: Page 600-602 problems 7 - 36
O
Extra Practice: Algebra 2 Resources by Chapter Section 11.1
O
Practice A and B page 375-376
O
Enrichment and Extension page 377
O
Puzzle Time Page 378
O
Student Journal Algebra 2 Section 11.1
O
Using Normal Distribution Page 314-318
O
Assessment Book Algebra 2 Section 11.3
O
Page 144
Textbook Connection
Spring Board
O
Lesson 36-1: Shapes of Distribution
O
Classwork Page 553-556
O
Homework Page 557
O
Lesson 36-2 : Characteristics of the Normal
Distribution
O
Classwork Page 558-560
O
Homework Page 561
Textbook Connection
CPM
O
9.3.2 How can I make predictions?
O
The Normal Probability Density Function
O
Classwork Page 477-480
O
Homework Page 480-481
Additional Resources
O
Illustrative Mathematics -
www.illustrativemathematics.com
O
SAT Scores
O
Do you Fit In This Car?
O
Should we Send Out a Certificate?
O
Khan Academy - www.khanacademy.org
O
Engage NY Common Core Curriculum
O
Algebra II Module 4
O
https://www.engageny.org/resource/algebra-ii-module-
4-topic-b-lesson-8-0
Need Help?
Contact your
Secondary Math Coordinator
Facilitator notes
Time: n/a
Handouts/participant activity: n/a
Focus points:
Title Page
Lesson resources for teachers to teach students about analyzing and understanding normal distribution in statistics. Includes learning standards, agenda, presentation, vocabulary activities, and additional resources. Emphasizes using mean and standard deviation to fit data to a normal distribution, estimating population percentages, and recognizing when such procedures are inappropriate. Encourages the use of calculators, spreadsheets, and tables to estimate areas under the normal curve. Aligns with Common Core Standards and promotes mathematical practices. Prerequisite skills and focus areas for middle and high school students are also outlined.

Download Presentation

Please find below an Image/Link to download the presentation.
The content on the website is provided AS IS for your information and personal use only. It may not be sold, licensed, or shared on other websites without obtaining consent from the author.If you encounter any issues during the download, it is possible that the publisher has removed the file from their server.
You are allowed to download the files provided on this website for personal or commercial use, subject to the condition that they are used lawfully. All files are the property of their respective owners.
The content on the website is provided AS IS for your information and personal use only. It may not be sold, licensed, or shared on other websites without obtaining consent from the author.
E N D
Presentation Transcript
Algebra 2 Statistics Normal Distribution Unit 5
Purpose Provided is a lesson for teachers to use to help students understand and analyze normal distribution. Included are the following: Statistics and Probability Learning Progression Standards Lesson Agenda Getting Ready for the Lesson (Resources and Tips) Lesson (Presentation and Video) Vocabulary Activities Textbook Connections Additional Resources
Common Core Standards S S- -ID.4. ID.4. Use the mean and standard deviation of a data set to fit it to a normal distribution and to estimate population percentages. Recognize that there are data sets for which such a procedure is not appropriate. Use calculators, spreadsheets, and tables to estimate areas under the normal curve. (Apply, 2) (Remember, 1) (Apply, 2)
Math Practices MP4 Model with mathematics MP7 Look for and make use of structure
Statistics & Probability Prerequisite Skills: CC Math 6-8 http://commoncoretools.me/wp-content/uploads/2012/06/ccss_progression_sp_hs_2012_04_21_bis.pdf
Middle School Focus Grade 7 O Use Use random random sampling sampling to draw inferences about a population. O Draw Draw informal informal comparative comparative inferences inferences about two populations. O Investigate chance processes and develop, use, and develop, use, and evaluate probability evaluate probability models. models. Grade 6 O Develop understandi ng of statistical statistical variability. variability. O Summarize and describe describe distributions. distributions. Grade 8 Investigate patterns of association in bivariate data. bivariate data. Source: California Framework
High School Focus Algebra I Summarize, represent, and interpret data on a single count or single count or measurement measurement variable. variable. Summarize, represent, and interpret data on two categorical and categorical and quantitative quantitative variables. variables. Interpret Interpret linear linear models. models. Geometry Conditional Conditional Probability and the Rules of and the Rules of Probability Probability Understand independence and conditional probability and conditional probability and use them to interpret data. Use the rules of probability to compute probabilities of compound events compound events in a uniform probability model. Using Using Probability to Make Probability to Make Decisions Decisions Use probability to evaluate outcomes of evaluate outcomes of decisions decisions Algebra II Interpreting Interpreting Categorical and Quantitative and Quantitative Data Summarize, represent, and interpret data on a single count or single count or measurement variable measurement variable. . Making Making Inferences and Inferences and Justifying Justifying Conclusions Conclusions Understand and evaluate random random processes processes underlying statistical underlying statistical experiments. experiments. Make Make inferences and inferences and justify conclusions justify conclusions from sample surveys, experiments, and observational studies. Using Using Probability to Make Probability to Make Decisions Decisions Use probability to evaluate outcomes of evaluate outcomes of decisions. decisions. Categorical Data Probability independence two Source: California Framework
Learning Progression: HS Statistics & Probability http://commoncoretools.me/wp-content/uploads/2012/06/ccss_progression_sp_hs_2012_04_21_bis.pdf
Lesson Agenda O Vocabulary O Video: O Lesson: Understand the properties of normal Understand the properties of normal distribution and identify situations that can be distribution and identify situations that can be modeled by a normal distribution curve by modeled by a normal distribution curve by examining distributions of one examining distributions of one- -variable distribution sets distribution sets O Textbook Connections variable
Normal Distribution Planning for Instruction with understanding Normal Distribution
Getting Ready O Pre-assessment- used to determine understanding of prerequisite skills O Prerequisite skills include O 6.SP 2-3 O Understand that a set of data collected to answer a statistical question has a distribution which can be described by its center, spread, and overall shape. O Recognize that a measure of center for a numerical data set summarizes all of its values with a single number, while a measure of variation describes how its values vary with a single number O 6.SP 5 O Summarize numerical data sets in relation to their context
Misconceptions and Anticipated Issues Common Issues Common Issues Suggested Strategies/Resources Suggested Strategies/Resources a. Use the additional practice worksheets from learnzilllion lesson b. Use more than 1 vocabulary organizer to address key vocabulary c. Allow students to use a calculator d. Analyze the graph and understand the standard variation vs mean a. Using the wrong total from the frequency table b. Misunderstanding the graph c. Wrong interpretation of mean or median d. Incorrect calculations for standard deviation
Required Resources Materials Required Materials Required Handouts: O Learnzillion presentation handouts O Learnzillion additional worksheets O https://learnzillion.com/lesson_plans/417
Needed Vocabulary O Normal Distribution O Data O Standard Deviation O Statistics O Median O Data Distribution Or you could use: Layered book, Frayer s Model etc. Verbal & Visual Association Example
Learnzillion For this lesson you need to create an account to access the handouts from Learnzillion. This is a free account and you will have access to many more lessons.
Normal Distribution https://learnzillion.com/lesson_plans/417
Planning and Time Activities Activities Time Time Notes Notes Preparation 2 hours Includes creating a pre- assessment, making copies, obtaining materials Pre-lessons 2 hours Review of 6th grade SP standards Vocabulary 1 hour Defining Normal Distribution M&M Task-Lesson 2 hours Explanation and completion of work Practice and Additional Tasks 2 hours Additional worksheets from LearnZillion, Textbook practice, Illustrative Mathematics Tasks Total Time Total Time 10 hours 10 hours
Textbook Connection Big Ideas O Textbook Algebra 2 Section 11.1 Textbook Algebra 2 Section 11.1 O Classwork: Page 600 problems 1 Classwork: Page 600 problems 1 6 6 O Homework: Page 600 Homework: Page 600- -602 problems 7 O Extra Practice: Algebra 2 Resources by Chapter Section 11.1 Extra Practice: Algebra 2 Resources by Chapter Section 11.1 O Practice A and B page 375 Practice A and B page 375- -376 O Enrichment and Extension page 377 Enrichment and Extension page 377 O Puzzle Time Page 378 Puzzle Time Page 378 O Student Journal Algebra 2 Section 11.1 Student Journal Algebra 2 Section 11.1 O Using Normal Distribution Page 314-318 O Assessment Book Algebra 2 Section 11.3 Assessment Book Algebra 2 Section 11.3 O P Page 144 age 144 602 problems 7 - - 36 36 376
Textbook Connection Spring Board O Lesson 36 Lesson 36- -1: Shapes of Distribution 1: Shapes of Distribution O Classwork Page Classwork Page 553 O Homework Page Homework Page 557 553- -556 557 556 O Lesson 36 Lesson 36- -2 : Characteristics of the Normal 2 : Characteristics of the Normal Distribution Distribution O Classwork Page 558 Classwork Page 558- -560 O Homework Page 561 Homework Page 561 560
Textbook Connection CPM O 9.3.2 How can I make predictions? O The Normal Probability Density Function O Classwork Page 477-480 O Homework Page 480-481
Additional Resources O Illustrative Illustrative Mathematics Mathematics - - www.illustrativemathematics.com www.illustrativemathematics.com O SAT Scores O Do you Fit In This Car? O Should we Send Out a Certificate? O Khan Academy Khan Academy - - www.khanacademy.org www.khanacademy.org O Engage NY Common Core Curriculum Engage NY Common Core Curriculum O Algebra II Module 4 O https://www.engageny.org/resource/algebra-ii-module- 4-topic-b-lesson-8-0
Need Help? Contact your Secondary Math Coordinator