Machine Learning: Decision Trees and Overfitting
Foundations of Artificial Intelligence delve into the intricacies of Machine Learning, focusing on Decision Trees, generalization, overfitting, and model selection. The extensions of the Decision Tree Learning Algorithm address challenges such as noisy data, model overfitting, and methods like cross-validation and gain ratios. Overfitting in machine learning is illustrated using examples like predicting dice rolls, emphasizing the need to avoid irrelevant attributes in decision-making processes to prevent performance degradation in test sets.

Download Presentation

Please find below an Image/Link to download the presentation.
The content on the website is provided AS IS for your information and personal use only. It may not be sold, licensed, or shared on other websites without obtaining consent from the author.If you encounter any issues during the download, it is possible that the publisher has removed the file from their server.
You are allowed to download the files provided on this website for personal or commercial use, subject to the condition that they are used lawfully. All files are the property of their respective owners.
The content on the website is provided AS IS for your information and personal use only. It may not be sold, licensed, or shared on other websites without obtaining consent from the author.
E N D
Presentation Transcript
CS 4700: Foundations of Artificial Intelligence Prof. Bart Selman selman@cs.cornell.edu Machine Learning: Decision Trees --- Generalization and Overfitting Russell & Norvig: 18.3.5, 18.3.6 & 18.4 1
Extensions of the Decision Tree Learning Algorithm (Briefly) Noisy data Overfitting and Model Selection Cross Validation Missing Data (R&N, Section 18.3.6) Using gain ratios (R&N, Section 18.3.6) Real-valued data (R&N, Section 18.3.6) Generation of rules and pruning 2
Machine Learning: Noisy data Many kinds of "noise" that could occur in the examples: Two examples have same attribute/value pairs ( feature values ), but different classifications report majority classification for the examples corresponding to the node deterministic hypothesis. report estimated probabilities of each classification using the relative frequency (if considering stochastic hypotheses) Some values of attributes are incorrect because of errors in the data acquisition process or the preprocessing phase The classification is wrong (e.g., + instead of -) because of some error Given noisy data (unavoidable) --- make sure you don t overfit your learned model. 3
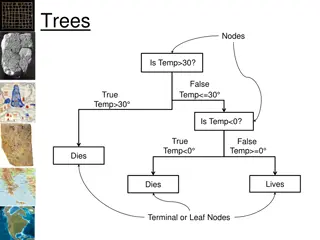
Overfitting Ex.: Problem of trying to predict the roll of a die. The experiment data include features: (1) Day of the week (2) Month of the week (3) Color of the die . DTL may find an hypothesis that fits the data but with irrelevant attributes. Some attributes are irrelevant to the decision-making process, e.g., color of a die is irrelevant to its outcome but they are used to differentiate examples Overfitting. Overfitting means fitting the training set too well performance on the test set degrades. I.e. validation error goes up! 4
If the hypothesis space has many dimensions because of a large number of attributes, we may find meaningless regularity in the data that is irrelevant to the true, important, distinguishing features. Fix by pruning to lower # nodes in the decision treeor put a limit on number of nodes created. For example, if Gain of the best attribute at a node is below a threshold, stop and make this node a leaf rather than generating children nodes. Overfitting is a key problem in machine learning. There are formal results on the number of examples needed to properly train an hypothesis of a certain complexity ( number of parameters or # nodes in DT). The more params, the more data is needed. Neural nets: Choosing the right number of layers and nodes in layers. 5
Overfitting Let s consider D, the entire distribution of data, and T, the training set. Hypothesis h H overfits D if h h H such that (1) errorT(h) < errorT(h ) [i.e. doing well on training set] but (2) errorD(h) > errorD(h ) What do we care about most (1) or (2)? Estimate error on full distribution by using test data set. Error on test data: Generalization error (want it low!!) Generalization to unseen examples/data is what we care about. 6
Data overfitting is the arguably the most common pitfall in machine learning. Why? 1) Temptation to use as much data as possible to train on. ( Ignore test till end. Test set too small.) Data peeking not noticed. 1) Temptation to fit very complex hypothesis (e.g. large decision tree). In general, the larger the tree, the better the fit to the training data. It s hard to think of a better fit to the training data as a worse result. Often difficult to fit training data well, so it seems that a good fit to the training data means a good result. Note: Modern savior: Massive amounts of data to train on! Somewhat characteristic of ML AI community vs. traditional statistics community. 7
Key figure in machine learning We set tree size as a parameter in our DT learning alg. Optimal tree size Error rate Overfitting kicks in errorT(h) < errorT(h ) but errorD(h) > errorD(h ) Tree size Note: with larger and larger trees, we just do better and better on the training set! But note the performance on the validation set degrades! Note: Similar curves can happen when training too long in complex hypothesis space with lots of parameters to set. 8
Aside: From intro lecture: Is this an example of overfitting or something else? 9
Reflection of history of AI ---Overfitting or something else? Cars climbing up trees (at CMU) Road sides look like parallel lines. But, unfortunately, so do trees! Related incident : Task: Given pictures of wooded areas, find pictures where tanks are hidden. (late 1960s, DARPA challenge) Remarkably good performance on test set (like 99% correct). Then, general noticed, pictures containing tanks were taken in the late afternoon. Without tanks, in the morning. What is the issue here? Good or bad learning? Overfitting? Or something else? ML is good but: The training data itself flawed !!!! Also, problem with algorithmic bias. ML methods learn / reinforce unwanted biases eg in hiring or loan decisions. But, data scientists may not realize it!
Procedure for finding the optimal tree size is called model selection. See section 18.4.1 R&N and Fig. 18.8. To determine validation error for each tree size, use k-fold cross- validation. (Uses the data better than holdout cross-validation. ) Uses all data - test set --- k times splits that set into a training set and a validation set. After right decision tree size is found from the error rate curve on validation data, train on all training data to get final decision tree (of the right size). Finally, evaluate tree on the test data (not used before) to get true generalization error (to unseen examples). 11
Summary: When to use Decision Trees Instances presented as attribute / feature - value pairs Method of approximating discrete-valued functions Target function has discrete values: classification problems Robust to noisy data: Training data may contain errors missing attribute values Typical bias: prefer smaller trees (Ockham's razor ) Widely used, practical and easy to interpret results 12
Inducing decision trees is one of the most widely used learning methods in practice Can outperform human experts in many problems Strengths include Fast simple to implement human readable can convert result to a set of easily interpretable rules empirically valid in many commercial products handles noisy data Weaknesses include: "Univariate" splits/partitioning using only one attribute at a time so limits types of possible trees large decision trees may be hard to understand requires fixed-length feature vectors non-incremental (i.e., batch method) requires good features. Feature engineering. [Alleviated by Deep Learning.] Can be a legal requirement! Why? 13