Decision Trees in Machine Learning


Machine Learning:
Machine Learning:
Decision Trees
Decision Trees
Chapter 18.1-18.3
Some material adopted from notes by Chuck Dyer

Decision Trees (DTs)
•
A
supervised
learning method used for
classification
and
regression
•
Given a set of training tuples, learn model
to predict one value from the others
–
Learned value typically a class (e.g., goodRisk)
•
Resulting model is simple to understand,
interpret, visualize and apply
Learning a Concept
The red groups are
negative
examples, blue
positive
Training data
A decision tree-induced partition
The red groups are negative examples, blue positive
Learning decision trees
•
Goal: Build
decision tree
to classify examples as
positive or negative instances of concept using
supervised learning from training data
•
A
decision tree
is a tree where
–
non-leaf nodes have an
attribute (feature)
–
leaf nodes have a classification
(+ or -)
–
each arc has a possible value of
its attribute
•
Generalization: allow for >2 classes
–
e.g., classify stocks as {sell, hold, buy}Expressiveness of Decision Trees
•
Can express any function of input attributes, e.g. for
Boolean functions, truth table row
→
path to leaf:
•
There’s a consistent decision tree for any training set
with one path to leaf for each example (assuming
deterministic), but it probably won't generalize to
new examples
•
We prefer more
compact
decision trees
Inductive learning and bias
•
Suppose that we want to learn a function
f(x) = y
and
we’re given sample (x,y) pairs, as in figure (a)
•
Can make several hypotheses about f, e.g.: (b), (c) & (d)
•
Preference reveals learning technique
bias
, e.g.:
–
prefer piece-wise functions
–
prefer a smooth function
–
prefer a simple function and treat outliers as noise
Preference bias: Occam’s Razor
•
William of Ockham (1285-1347)
–
“
non sunt multiplicanda entia praeter necessitatem
”
–
entities are not to be multiplied beyond necessity
•
Simplest
consistent explanation is the best
•
Smaller
decision trees correctly classifying
training examples preferred over larger ones
•
Finding
the
smallest decision tree is NP-hard,
so we use algorithms that find reasonably
small ones
Hypothesis spaces
•
How many distinct decision trees with
n
Boolean attributes?
–
= number of Boolean functions
–
= number of distinct truth tables with 2
n
rows = 2
2
n
–
e.g., with 6 Boolean attributes, 18,446,744,073,709,551,616 trees
•
How many conjunctive hypotheses (e.g.,
Hungry
Rain
)?
–
Each attribute can be in (positive), in (negative), or out
3
n
distinct conjunctive hypotheses
–
e.g., with 6 Boolean attributes, 729 trees
•
A more expressive hypothesis space
–
increases chance that target function can be expressed
–
increases number of hypotheses consistent with training set
may get worse predictions in practice
R&N’
s restaurant domain
•
Develop decision tree for decision patron makes
when deciding whether or not to wait for a table
•
Two classes: wait, leave
•
Ten attributes: Alternative available? Bar in
restaurant? Is it Friday? Are we hungry? How full
is restaurant? How expensive? Is it raining? Do we
have reservation? What type of restaurant is it?
Estimated
waiting time?
•
Training set of 12 examples
•
~ 7000 possible cases
Attribute-based representations
•
Examples described by
attribute values
(Boolean, discrete, continuous),
e.g., situations where I will/won't wait for a table
•
Classification
of examples is
positive
(T) or
negative
(F)
•
Serves as a training set
Decision tree from
introspection
Issues
•
It’s like
20 questions
•
We can generate many decision trees
depending on what attributes we ask about
and in what order
•
How do we decide?
•
What makes one decision tree better than
another: number of nodes? number of
leaves? maximum depth?
ID3
/
C4.5
/ J48 Algorithm
•
Greedy algorithm for decision tree construction
developed by
Ross Quinlan
circa 1987
•
Top-down construction of tree by recursively
selecting
best attribute
to use at current node
–
Once attribute selected for current node, generate
child nodes, one for each possible attribute value
–
Partition examples using values of attribute, & assign
these subsets of examples to appropriate child node
–
Repeat for each child node until all examples
associated with node are all positive or negative
Choosing best attribute
•
Key problem: choose attribute to split a given
set of examples
•
Possibilities for choosing attribute:
–
Random:
Select one at random
–
Least-values:
one with smallest # of possible values
–
Most-values:
one with largest # of possible values
–
Max-gain:
one with largest expected
information
gain,
i
.e., gives smallest expected size of subtrees
rooted at its children
•
The ID3 algorithm uses
max-gain
Restaurant example
Random
: Patrons or Wait-time;
Least-values
: Patrons;
Most-values
: Type;
Max-gain
: ???
Patrons variable
Type variable
Choosing an attribute
Idea: good attribute splits examples into
subsets that are (ideally)
all positive
or
all
negative
Which is better:
Patrons?
or
Type?
Splitting
examples
by testing
attributes
ID3-induced
decision tree
Compare the two Decision Trees
Information theory 101
•
Sprang fully formed from
Claude Shannon
’s
seminal work:
Mathematical Theory of
Communication
in 1948
•
Intuitions
–
Common words (a, the, dog) shorter than less
common ones (parlimentarian, foreshadowing)
–
Morse code: common letters have shorter encodings
•
Information inherent in data/message (
inform-
ation entropy
) measured in minimum number of
bits needed to store/send using a good
encoding
Information theory 101
•
Information entropy
... tells how much
information there is in an event. More uncertain
an event is, more information it contains
•
Receiving a message is an event
•
How much information is in these messages
–
The sun rose today!
–
It’s sunny today in Honolulu!
–
The coin toss is heads!
–
It’s sunny today in Seattle!
–
Life discovered on Mars!
None
A lot
Information theory 101
•
For
n equally probable
possible messages or
data values, each has probability
1/n
•
Information of a message is -log(p) = log(n)
e.g., with 16 messages, then log(16) = 4 and we need 4
bits to identify/send each message
•
For
probability distribution P
(
p
1
,
p
2
…
p
n
)
for n
messages, its information (aka H or
entropy
) is:
I(P) = -(p
1
*log(p
1
) + p
2
*log(p
2
) + .. + p
n
*log(p
n
))
Entropy of a distribution
I(P) = -(p
1
*log(p
1
) + p
2
*log(p
2
) + .. + p
n
*log(p
n
))
•
Examples:
–
If P is (0.5, 0.5) then I(P) = 0.5*1 + 0.5*1 = 1
–
If P is (0.67, 0.33) then I(P) = -(2/3*log(2/3) +
1/3*log(1/3)) = 0.92
–
If P is (1, 0) then I(P) = 1*1 + 0*log(0) = 0
•
More
uniform probability
distribution,
greater its
information
: more information is conveyed by a
message telling you which event actually occurred
•
Entropy is the average number of bits/message
needed to represent a stream of messages
Example: Huffman code
•
In 1952 MIT student David Huffman devised (for a
homework assignment!) a coding scheme that’s
optimal when all data
probabilities are powers of 1/2
•
A
Huffman code
can be built as followings:
–
Rank symbols in order of probability of occurrence
–
Successively combine 2 symbols of lowest probabil-
ity to form new symbol; eventually we have binary
tree where each node is probability of nodes
beneath it
–
Trace path to each leaf, noticing direction at each
node
Huffman code example
M P
A .125
B .125
C .25
D .5
Huffman code example
M P
A .125
B .125
C .25
D .5
.5
.5
1
.125
.125
.25
A
C
B
D
.25
0
1
0
0
1
1
If we use this code to many
messages (A,B,C or D) with this
probability distribution, then, over
time, the average bits/message
should approach
1.75
Information for classification
If set T of records is divided into disjoint exhaustive classes
(C
1
,C
2
,..,C
k
) by value of class attribute, then information
needed to identify class of an element of T is:
Info(T) = I(P)
where P is the probability distribution of partition (C
1
,C
2
,..,C
k
):
P = (|C
1
|/|T|, |C
2
|/|T|, ..., |C
k
|/|T|)
High information
C1
C2
C3
C1
C2
C3
Lower information
Information for classification II
If we further divide T wrt attribute X into sets {T1
,T
2
,
..,T
n
}, the information needed to identify class of an
element of T becomes the weighted average of the
information needed to identify the class of an element
of T
i
, i.e. the weighted average of Info(T
i
):
Info(X,T) =
|T
i
|/|T| * Info(T
i
)
High information
C1
C2
C3
Low information
C1
C2
C3
Information gain
•
Gain(X,T) = Info(T) - Info(X,T)
is difference of
–
info needed to identify element of T and
–
info needed to identify element of T after value of
attribute X known
•
This is gain in information due to attribute X
•
Used to rank attributes and build DT where
each node uses attribute with greatest gain of
those not yet considered in path from root
•
goal:
create small DTs
to minimize questions
Computing Information Gain
French
Italian
Thai
Burger
Empty
Some
Full
Y
Y
Y
Y
Y
Y
N
N
N
N
N
N
Gain (Patrons, T) = ?
Gain (Type, T) = ?
I(P) = -(p
1
*log(p
1
) + p
2
*log(p
2
) + .. + p
n
*log(p
n
))
Computing information gain
Gain (Patrons, T) = 1 - .47 = .53
Gain (Type, T) = 1 – 1 = 0
I(P) = -(p
1
*log(p
1
) + p
2
*log(p
2
) + .. + p
n
*log(p
n
))
How well does it work?
Case studies show that decision trees often at
least as accurate as human experts
–
Study for diagnosing breast cancer had humans
correctly classifying the examples 65% of the time;
DT classified 72% correct
–
British Petroleum designed DT for gas-oil
separation for offshore oil platforms that replaced
an earlier rule-based expert system
–
Cessna designed an airplane flight controller using
90,000 examples and 20 attributes per example
Extensions of ID3
•
Using gain ratios
•
Real-valued data
•
Noisy data and overfitting
•
Generation of rules
•
Setting parameters
•
Cross-validation for experimental validation of
performance
•
C4.5:
extension of ID3 accounting for unavailable
values, continuous attribute value ranges, pruning
of decision trees, rule derivation, etc.
Using gain ratios
•
Information gain criterion favors attributes that have a
large number of values
–
An attribute D with a distinct value for each record
has Info(D,T) 0, thus Gain(D,T) is maximal
•
To compensate, use GainRatio instead of Gain:
GainRatio(D,T) = Gain(D,T) / SplitInfo(D,T)
•
SplitInfo(D,T) is information due to split of T on basis
of value of categorical attribute D
SplitInfo(D,T) = I(|T1|/|T|, |T2|/|T|, .., |Tm|/|T|)
where {T1, …
Tm} is partition of T induced by value of D
Computing gain ratio
•
I(T) = 1
•
I (Pat, T) = .47
•
I (Type, T) = 1
Gain (Pat, T) =.53
Gain (Type, T) = 0
SplitInfo (Pat, T) = - (1/6 log 1/6 + 1/3 log 1/3 + 1/2 log 1/2) = 1/6*2.6 + 1/3*1.6 + 1/2*1
= 1.47
SplitInfo (Type, T) = 1/6 log 1/6 + 1/6 log 1/6 + 1/3 log 1/3 + 1/3 log 1/3
= 1/6*2.6 + 1/6*2.6 + 1/3*1.6 + 1/3*1.6 = 1.93
GainRatio (Pat, T) = Gain (Pat, T) / SplitInfo(Pat, T) = .53 / 1.47 = .36
GainRatio (Type, T) = Gain (Type, T) / SplitInfo (Type, T) = 0 / 1.93 = 0
Real-valued data?
•
Select thresholds defining intervals so each
becomes a discrete value of attribute
•
Use heuristics: e.g.,
always divide into quartiles
•
Use domain knowledge: e.g.,
divide age into
infant (0-2), toddler (3-5), school-aged (5-8)
•
Or treat this as another learning problem
–
Try different ways to discretize continuous variable;
see which yield
better results w.r.t. some metric
–
E.g., try midpoint between every pair of values
Noisy data?
Many kinds of
noise
can occur in training data
•
Two examples have same attribute/value pairs,
but different classifications
•
Some attribute values wrong due to errors in
the data acquisition or preprocessing phase
•
Classification is wrong (e.g., + instead of -)
because of some error
•
Some attributes irrelevant to decision-making,
e.g., color of a die is irrelevant to its outcome
Overfitting
•
Overfitting
occurs when a statistical
model describes random error or noise instead
of underlying relationship
•
If hypothesis space has many dimensions (many
attributes) we may find
meaningless regularity
in data irrelevant to true distinguishing features
Students with an
m
in first name, born in July, &
whose SSN digits sum to an odd number get better
grades in CMSC 471
•
If we have
too little training data
, even a
reasonable hypothesis space can
overfit
Avoiding Overfitting
•
Remove irrelevant features
–
E.g., remove
‘
year observed
’
,
‘
month
observed
’
,
‘
day observed
’
,
‘
observer
name
’
from feature vector
•
Getting more training data
•
Pruning lower nodes in the decision tree
–
E.g., if gain of best attribute at a node is
below a threshold, stop and make this node
a leaf rather than generating children nodes
Pruning decision trees
•
Pruning a decision tree is done by replacing a whole
subtree by a leaf node
•
Replacement takes place if the expected error rate
in the subtree is greater than in the single leaf, e.g.,
–
Training: 1 training red success and 2 training blue failures
–
Test: 3 red failures and one blue success
–
Consider replacing this subtree by a single Failure node.
•
After replacement, only 2 errors instead of 5
2 success
4 failure
FAILURE
Training
Test
Pruned
Converting decision trees to rules
•
Easy to get rules from decision tree: write rule
for each path from the root to leaf
•
Rule’s left-hand side built from the label of the
nodes & labels of arcs
•
Resulting rules set can be simplified:
–
Let LHS be the left hand side of a rule
–
LHS’
obtained from LHS by eliminating some conditions
–
Replace LHS by LHS' in this rule if the subsets of the
training set satisfying LHS and LHS' are equal
–
A rule may be eliminated by using meta-conditions such
as
“
if no other rule applies
”
Summary: decision tree learning
•
Widely used learning methods in practice for
problems with relatively
few features
•
Strengths
–
Fast and simple to implement
–
Can convert result to a set of easily interpretable rules
–
Empirically valid in many commercial products
–
Handles noisy data
–
Easy for people to understand
•
Weaknesses
–
Large decision trees may be hard to understand
–
Requires fixed-length feature vectors
–
Non-incremental (i.e., batch method)
–
Univariate splits/partitioning using only one attribute at a
time so limits types of possible trees
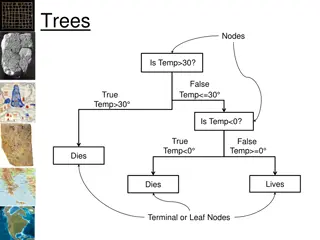
Decision trees are a popular supervised learning method used for classification and regression tasks. They involve learning a model from training data to predict a value based on other attributes. Decision trees provide a simple and interpretable model that can be visualized and applied effectively. By building a decision tree, examples can be classified into positive or negative instances of a concept. The expressiveness of decision trees allows them to represent any function of input attributes, although more compact trees are preferred for better generalization to new examples.

Download Presentation

Please find below an Image/Link to download the presentation.
The content on the website is provided AS IS for your information and personal use only. It may not be sold, licensed, or shared on other websites without obtaining consent from the author.If you encounter any issues during the download, it is possible that the publisher has removed the file from their server.
You are allowed to download the files provided on this website for personal or commercial use, subject to the condition that they are used lawfully. All files are the property of their respective owners.
The content on the website is provided AS IS for your information and personal use only. It may not be sold, licensed, or shared on other websites without obtaining consent from the author.
E N D
Presentation Transcript
Machine Learning: Decision Trees Chapter 18.1-18.3 Some material adopted from notes by Chuck Dyer
Decision Trees (DTs) A supervised learning method used for classification and regression Given a set of training tuples, learn model to predict one value from the others Learned value typically a class (e.g., goodRisk) Resulting model is simple to understand, interpret, visualize and apply
Learning a Concept The red groups are negative examples, blue positive Attributes Size: large, small Color: red, green, blue Shape: square, circle Task Classify new object with a size, color & shape as positive or negative
Training data Size Large Large Small Small Large Large Small Small Large Small Large Small Color Green Green Green Green Red Red Red Red Blue Blue Blue Blue Shape Square Circle Square Circle Square Circle Square Circle Square Square Circle Circle class Negative Negative Positive positive Positive Positive Positive Positive Negative Positive Positive Positive
A decision tree-induced partition The red groups are negative examples, blue positive Negative things are big, green shapes and big, blue squares
Learning decision trees Goal: Build decision tree to classify examples as positive or negative instances of concept using supervised learning from training data A decision tree is a tree where non-leaf nodes have an attribute (feature) leaf nodes have a classification (+ or -) each arc has a possible value of its attribute Generalization: allow for >2 classes e.g., classify stocks as {sell, hold, buy} Color green blue red Size + Shape big small square round - + Size big + small - +
Expressiveness of Decision Trees Can express any function of input attributes, e.g. for Boolean functions, truth table row path to leaf: There s a consistent decision tree for any training set with one path to leaf for each example (assuming deterministic), but it probably won't generalize to new examples We prefer more compact decision trees
Inductive learning and bias Suppose that we want to learn a function f(x) = y and we re given sample (x,y) pairs, as in figure (a) Can make several hypotheses about f, e.g.: (b), (c) & (d) Preference reveals learning technique bias, e.g.: prefer piece-wise functions prefer a smooth function prefer a simple function and treat outliers as noise
Preference bias: Occams Razor William of Ockham (1285-1347) non sunt multiplicanda entia praeter necessitatem entities are not to be multiplied beyond necessity Simplest consistent explanation is the best Smaller decision trees correctly classifying training examples preferred over larger ones Finding the smallest decision tree is NP-hard, so we use algorithms that find reasonably small ones
R&Ns restaurant domain Develop decision tree for decision patron makes when deciding whether or not to wait for a table Two classes: wait, leave Ten attributes: Alternative available? Bar in restaurant? Is it Friday? Are we hungry? How full is restaurant? How expensive? Is it raining? Do we have reservation? What type of restaurant is it? Estimated waiting time? Training set of 12 examples ~ 7000 possible cases
Attribute-based representations Examples described by attribute values (Boolean, discrete, continuous), e.g., situations where I will/won't wait for a table Classification of examples is positive (T) or negative (F) Serves as a training set
Decision tree from introspection
Issues It s like 20 questions We can generate many decision trees depending on what attributes we ask about and in what order How do we decide? What makes one decision tree better than another: number of nodes? number of leaves? maximum depth?
ID3 / C4.5 / J48 Algorithm Greedy algorithm for decision tree construction developed by Ross Quinlan circa 1987 Top-down construction of tree by recursively selecting best attribute to use at current node Once attribute selected for current node, generate child nodes, one for each possible attribute value Partition examples using values of attribute, & assign these subsets of examples to appropriate child node Repeat for each child node until all examples associated with node are all positive or negative
Choosing best attribute Key problem: choose attribute to split a given set of examples Possibilities for choosing attribute: Random: Select one at random Least-values: one with smallest # of possible values Most-values: one with largest # of possible values Max-gain: one with largest expected information gain, i.e., gives smallest expected size of subtrees rooted at its children The ID3 algorithm uses max-gain
Restaurant example Random: Patrons or Wait-time; Least-values: Patrons; Most-values: Type; Max-gain: ??? N French Y Y N Italian Type variable Thai N Y N Y N Y N Y Burger Empty Some Full Patrons variable
stay leave Choosing an attribute Idea: good attribute splits examples into subsets that are (ideally) all positive or all negative Which is better: Patrons? or Type?
Splitting examples by testing attributes
ID3-induced decision tree
Information theory 101 Sprang fully formed from Claude Shannon s seminal work: Mathematical Theory of Communication in 1948 Intuitions Common words (a, the, dog) shorter than less common ones (parlimentarian, foreshadowing) Morse code: common letters have shorter encodings Information inherent in data/message (inform- ation entropy) measured in minimum number of bits needed to store/send using a good encoding
Information theory 101 Information entropy ... tells how much information there is in an event. More uncertain an event is, more information it contains Receiving a message is an event How much information is in these messages The sun rose today! It s sunny today in Honolulu! The coin toss is heads! It s sunny today in Seattle! Life discovered on Mars! None A lot
Information theory 101 For n equally probable possible messages or data values, each has probability 1/n Information of a message is -log(p) = log(n) e.g., with 16 messages, then log(16) = 4 and we need 4 bits to identify/send each message For probability distribution P (p1,p2 pn) for n messages, its information (aka H or entropy) is: I(P) = -(p1*log(p1) + p2*log(p2) + .. + pn*log(pn))
Entropy of a distribution I(P) = -(p1*log(p1) + p2*log(p2) + .. + pn*log(pn)) Examples: If P is (0.5, 0.5) then I(P) = 0.5*1 + 0.5*1 = 1 If P is (0.67, 0.33) then I(P) = -(2/3*log(2/3) + 1/3*log(1/3)) = 0.92 If P is (1, 0) then I(P) = 1*1 + 0*log(0) = 0 More uniform probability distribution, greater its information: more information is conveyed by a message telling you which event actually occurred Entropy is the average number of bits/message needed to represent a stream of messages
Information for classification If set T of records is divided into disjoint exhaustive classes (C1,C2,..,Ck) by value of class attribute, then information needed to identify class of an element of T is: Info(T) = I(P) where P is the probability distribution of partition (C1,C2,..,Ck): P = (|C1|/|T|, |C2|/|T|, ..., |Ck|/|T|) C1 C2 C3 C1 C2 C3 High information Lower information
Information for classification II If we further divide T wrt attribute X into sets {T1,T2, ..,Tn}, the information needed to identify class of an element of T becomes the weighted average of the information needed to identify the class of an element of Ti, i.e. the weighted average of Info(Ti): Info(X,T) = |Ti|/|T| * Info(Ti) C1 C2 C3 C1 C2 C3 High information Low information
Information gain Gain(X,T) = Info(T) - Info(X,T) is difference of info needed to identify element of T and info needed to identify element of T after value of attribute X known This is gain in information due to attribute X Used to rank attributes and build DT where each node uses attribute with greatest gain of those not yet considered in path from root goal: create small DTs to minimize questions
Computing Information Gain French N Y Should we ask about restaurant type or how many patrons there are? Italian Y N Thai N Y N Y I(T) = ? N Y N Y Burger I (Pat, T) = ? Some Empty Full I (Type, T) = ? Gain (Patrons, T) = ? Gain (Type, T) = ? I(P) = -(p1*log(p1) + p2*log(p2) + .. + pn*log(pn))
Computing information gain I(T) = - (.5 log .5 + .5 log .5) = .5 + .5 = 1 N French Y Y N I (Pat, T) = 2/12 (0) + 4/12 (0) + 6/12 (- (4/6 log 4/6 + 2/6 log 2/6)) = 1/2 (2/3*.6 + 1/3*1.6) = .47 Italian Thai N Y N Y N N Y Y Burger Empty Some Full I (Type, T) = 2/12 (1) + 2/12 (1) + 4/12 (1) + 4/12 (1) = 1 Gain (Patrons, T) = 1 - .47 = .53 Gain (Type, T) = 1 1 = 0 I(P) = -(p1*log(p1) + p2*log(p2) + .. + pn*log(pn))
How well does it work? Case studies show that decision trees often at least as accurate as human experts Study for diagnosing breast cancer had humans correctly classifying the examples 65% of the time; DT classified 72% correct British Petroleum designed DT for gas-oil separation for offshore oil platforms that replaced an earlier rule-based expert system Cessna designed an airplane flight controller using 90,000 examples and 20 attributes per example
Extensions of ID3 Using gain ratios Real-valued data Noisy data and overfitting Generation of rules Setting parameters Cross-validation for experimental validation of performance C4.5: extension of ID3 accounting for unavailable values, continuous attribute value ranges, pruning of decision trees, rule derivation, etc.
Real-valued data? Select thresholds defining intervals so each becomes a discrete value of attribute Use heuristics: e.g., always divide into quartiles Use domain knowledge: e.g., divide age into infant (0-2), toddler (3-5), school-aged (5-8) Or treat this as another learning problem Try different ways to discretize continuous variable; see which yield better results w.r.t. some metric E.g., try midpoint between every pair of values
Noisy data? Many kinds of noise can occur in training data Two examples have same attribute/value pairs, but different classifications Some attribute values wrong due to errors in the data acquisition or preprocessing phase Classification is wrong (e.g., + instead of -) because of some error Some attributes irrelevant to decision-making, e.g., color of a die is irrelevant to its outcome
Overfitting Overfitting occurs when a statistical model describes random error or noise instead of underlying relationship If hypothesis space has many dimensions (many attributes) we may find meaningless regularity in data irrelevant to true distinguishing features Students with an m in first name, born in July, & whose SSN digits sum to an odd number get better grades in CMSC 471 If we have too little training data, even a reasonable hypothesis space can overfit
Avoiding Overfitting Remove irrelevant features E.g., remove year observed , month observed , day observed , observer name from feature vector Getting more training data Pruning lower nodes in the decision tree E.g., if gain of best attribute at a node is below a threshold, stop and make this node a leaf rather than generating children nodes
Pruning decision trees Pruning a decision tree is done by replacing a whole subtree by a leaf node Replacement takes place if the expected error rate in the subtree is greater than in the single leaf, e.g., Training: 1 training red success and 2 training blue failures Test: 3 red failures and one blue success Consider replacing this subtree by a single Failure node. After replacement, only 2 errors instead of 5 Pruned Test Training Color red Color red FAILURE blue blue 2 success 4 failure 1 success 1 failure 1 success 3 failure 0 success 2 failures 1 success 0 failure
Converting decision trees to rules Easy to get rules from decision tree: write rule for each path from the root to leaf Rule s left-hand side built from the label of the nodes & labels of arcs Resulting rules set can be simplified: Let LHS be the left hand side of a rule LHS obtained from LHS by eliminating some conditions Replace LHS by LHS' in this rule if the subsets of the training set satisfying LHS and LHS' are equal A rule may be eliminated by using meta-conditions such as if no other rule applies
Summary: decision tree learning Widely used learning methods in practice for problems with relatively few features Strengths Fast and simple to implement Can convert result to a set of easily interpretable rules Empirically valid in many commercial products Handles noisy data Easy for people to understand Weaknesses Large decision trees may be hard to understand Requires fixed-length feature vectors Non-incremental (i.e., batch method) Univariate splits/partitioning using only one attribute at a time so limits types of possible trees

")