Impact of COVID-19 Pandemic on U.S. Census Bureau International Migration Data
The COVID-19 pandemic has significantly impacted the collection and analysis of international migration data by the U.S. Census Bureau. Challenges include decentralized data sources, bureaucratic hurdles, and survey disruptions. The American Community Survey (ACS) plays a crucial role in estimating migration trends but faces limitations such as non-response bias. Methodological impacts of COVID-19 on data estimation have also been observed.
Uploaded on Oct 08, 2024 | 3 Views
Download Presentation

Please find below an Image/Link to download the presentation.
The content on the website is provided AS IS for your information and personal use only. It may not be sold, licensed, or shared on other websites without obtaining consent from the author.If you encounter any issues during the download, it is possible that the publisher has removed the file from their server.
You are allowed to download the files provided on this website for personal or commercial use, subject to the condition that they are used lawfully. All files are the property of their respective owners.
The content on the website is provided AS IS for your information and personal use only. It may not be sold, licensed, or shared on other websites without obtaining consent from the author.
E N D
Presentation Transcript
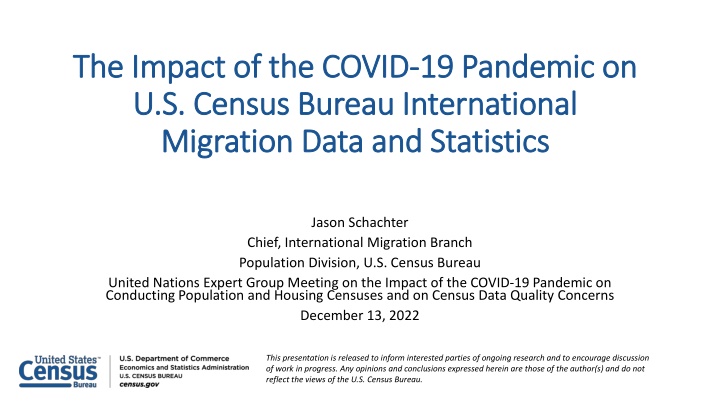
The Impact of the COVID The Impact of the COVID- -19 Pandemic on U.S. Census Bureau International U.S. Census Bureau International Migration Data and Statistics Migration Data and Statistics 19 Pandemic on Jason Schachter Chief, International Migration Branch Population Division, U.S. Census Bureau United Nations Expert Group Meeting on the Impact of the COVID-19 Pandemic on Conducting Population and Housing Censuses and on Census Data Quality Concerns December 13, 2022 This presentation is released to inform interested parties of ongoing research and to encourage discussion of work in progress. Any opinions and conclusions expressed herein are those of the author(s) and do not reflect the views of the U.S. Census Bureau.
Introduction Introduction The need for timely and accurate data on international migration became more urgent during the COVID-19 pandemic starting in 2020. However, measuring international migration is very challenging U.S. administrative records on international mobility exist in a decentralized statistical system: Data exchanges are nottimely due to bureaucratic hurdles for creating and enforcing inter-agency agreements Federal agencies use differentdefinitions and reporting periods Data are fragmented and notrepresentative of all international migrants The Census Bureau s Population Estimates Program (PEP) uses the American Community Survey (ACS) to estimate net international migration The ACS is a large annual household survey that provides comprehensive data on immigration Migration data are lagged, which prevents analysis of current year s trends In 2020, COVID-19 disruptions to survey operations led to exceptionally high non-response bias 1
American Community Survey (ACS) American Community Survey (ACS) Annual survey conducted monthly since 2005 Large sample size allows for studying small levels of geography 3.5 million addresses surveyed every year 1-year (national) and 5-year files (subnational) used to produce estimates Relevant questions: country of birth, U.S. citizenship status, year of entry, country of residence one year ago, etc. Some limitations Increasing non-response (unit and item) and imputation Timeliness of data (information lags measurement period) when sudden changes in migration patterns ( shocks ) 3
ACS Questionnaire: Country of Birth, Citizenship, Year of Entry ACS Questionnaire: Country of Birth, Citizenship, Year of Entry Foreign Born* * The term foreign born refers to people who aren t U.S. citizens by birth 4
ACS Residence ACS Residence One Year One Year Ago (ROYA) Question Ago (ROYA) Question 5
Methodological Impact of COVID Methodological Impact of COVID- -19 19 COVID-19 prevented us from using our usual methods for Vintage 2020 (V2020) and Vintage 2021 (V2021) estimates Impacted levels of migration to and from the United States (March 2020 onwards) Impacted quality of migration data collected by surveys (2020 ACS) How did we account for this to produce our Net International Migration (NIM) estimates? 6
Components of NIM Components of NIM Net Foreign-Born Emigration Foreign-Born Immigration Puerto Rico Migration Net Net Native Migration Net International Migration (NIM) Armed Forces Movement 7
The Impact of the COVID The Impact of the COVID- -19 Pandemic on International Travel/Migration (2020 International Travel/Migration (2020- -2021) 19 Pandemic on 2021) Border closures Closure of U.S. land borders with Mexico and Canada, except for commerce and essential travel from March 2020 to August 2021 (16 months) Flight restrictions from China (February) and European Union (March), for example 98% reduction in international flight traffic in April 2020 Travel restrictions lifted in November 2021 Visa restrictions Visa-issuing offices closed outside the United States, greatly reducing number of approved visas (March 20, 2020) Gradually re-opened starting summer of 2020 Migration policy Executive Order banning travel of non-residents from certain countries Executive Order pausing legal immigration (issuance of green cards, family based) (April 22, 2020, extended to the end of the year) Expanded to include almost all forms of legal migration, especially employment-based (H1B) February 2021 reversed policy and green cards began to be issued again 8
V2020 COVID V2020 COVID- -19 Adjustments 19 Adjustments V2020 (July 2019-June 2020) would have used 2019 ACS data on residence one year ago to produce NIM estimates, thus would not measure the impact of COVID-19 (March-June 2020) Adjustments to individual components: Foreign-Born Immigration (visa data/I-94 arrivals) Foreign-Born Emigration (Canadian flight, Mexican border data) Net Native Migration (U.S. flight data, Canadian administrative data on temporary and permanent residents) Puerto Rico (U.S. flight data) Significant decreases for foreign-born immigration and emigration, reduced net outmigration for natives and from Puerto Rico Adjustments decreased EY2020 NIM by 24% Essentially the same as setting NIM to 0 for 3 months 9
Flight Data: Inbound Flight Data: Inbound and Outbound and Outbound Passengers Passengers 2019 Inbound 2019 Outbound 2020 Inbound 2020 Outbound 12,000 Inbound and Outbound Air Passengers (x 1,000) 10,000 In 2020, inbound and outbound passenger totals fell well below 2019 levels: 8,000 6,000 Higher-than-expected net inflow for February and March, but both inbound and outbound passengers declined for those months 4,000 2,000 Inbound and outbound passengers for April 2020 fell to 2% of April 2019 levels 0 Jan Feb Mar Apr May Jun Jul Aug Sep Oct Nov Dec Month of Travel Data Source: Bureau of Transportation Statistics Form 41, T100 (International) Segment All Carriers 10
Visas Issued Overseas Visas Issued Overseas and Foreign and Foreign- -Born Immigration Immigration Born 2017 2018 2019 2020 350 300 Bureau of Consular Affairs began reporting monthly numbers in March 2017 250 Visas Issued (x 1,000) 200 Seasonal patterns consistent before March 2020 150 Visa issuance in March 2020 was 62% of March 2019 levels 100 50 Visa issuance in June 2020 fell to 12% of June 2019 levels 0 Jan Feb Mar Apr May Jun Jul Aug Sep Oct Nov Dec Month of Issuance Data Source: Department of State, Bureau of Consular Affairs Visa Statistics 11
Adjust Foreign Adjust Foreign- -Born Emigration: Country Data Born Emigration: Country Data Canadian Citizens Returning to Canada from US by Air Travelers to Mexico by Land 2018 Entry to Canada 2020 Entry to Canada 2019 Entry to Canada 2019 Entry to Mexico 2020 Entry to Mexico 7,000 30 6,000 25 Inbound Air Passengers (x 1,000) Land Border Travelers (x 1,000) 5,000 20 4,000 15 3,000 10 2,000 Jun 2020 fell to 9% of the average of June 2018 and June 2019 levels Travelers in April 2020 fell to 41% of April 2019 levels 5 1,000 0 0 Jan Feb Mar Apr May Jun Jul Aug Sep Oct Nov Dec Jan Feb Mar Apr May Month Surveyed in Mexico Jun Jul Aug Sep Oct Nov Dec Month of Entry into Canada Data Source: Mexican Institute of Statistics and Geography (INEGI), Border Traveler Survey (EVF); Statistics Canada, Border Enumeration from Primary Information Kiosks 12
V2020 NIM Adjustment Method V2020 NIM Adjustment Method Data were limited to inform adjustments Special tabulations from BTS, OIS, Statistics Canada Tried multiple methods/scenarios Flight data could not be used to adjust total NIM General assumptions Very likely that migration declined in March 2020 and remained low during the last quarter (April- June) of EY 2020 (near net 0 ) Averaged estimates derived from eight 2020 NIM series based on different assumptions applied to March-June 2020 First four scenarios assume 0 net migration for total NIM, or part of NIM, while last four adjust individual subcomponents of NIM 0 net for April-June NIM for March 10% monthly levels for sub-components Different estimates for Puerto Rico Based on ratio of observed to expected net passenger flights Adjustment for net native return in March 13
The Impact of COVID The Impact of COVID- -19 on the 2020 ACS 19 on the 2020 ACS In addition to reducing levels of migration, the pandemic impacted 2020 ACS data collection Sample reduction 1/3 of survey sample was lost when ACS data collection was paused Disproportionately impacted certain groups resulting in non-response bias for the foreign born Experimental weights did not account for undercoverage of the foreign born Impacted 2020 ACS data quality High levels of non-response High refusal rates Higher-than-usual imputation for migration-related variables Only released experimental estimates (not directly comparable to other years) 14
ACS Input Data Quality ACS Input Data Quality % of HUs sampled in ACS that did not respond to survey Source: ACS Sample Size and Data Quality web page (https://www.census.gov/acs/www/methodology/sample-size-and- data-quality/response-rates/index.php) 15
ACS Imputation Rates for Migration ACS Imputation Rates for Migration- -Related Variables (% of records where items were edited) Related Variables 30.0 25.0 23.9 21.6 Year of Entry 20.1 20.0 Item Imputation Rates Migration State/Foreign Country 16.1 Foreign Born 15.0 13.7 Citizenship 10.6 9.4 10.0 7.4 5.0 0.0 2006 2007 2008 2009 2010 2011 2012 2013 2014 2015 2016 2017 2018 2019 2020 Data Year Source: Internal calculations from 2006-2020 ACS 1-year data
ACS Time Series of Foreign ACS Time Series of Foreign- -Born Stock: 2006 Born Stock: 2006- -2020 2020 46 Millions 44 42 40 38 36 34 32 2006 2007 2008 2009 2010 2011 2012 2013 2014 2015 2016 2017 2018 2019 2020 Data Year Source: 2006-2020 ACS 1-year estimates 17
ACS Time Series of Foreign ACS Time Series of Foreign- -Born ROYA Abroad: 2006 Born ROYA Abroad: 2006- -2020 2020 1,600,000 1,400,000 1,200,000 1,000,000 800,000 600,000 400,000 200,000 0 2006 2007 2008 2009 2010 2011 2012 2013 2014 2015 2016 2017 2018 2019 2020 Data Year Source: 2006-2020 ACS 1-year estimates
Impact of COVID on V2021 NIM Estimates Impact of COVID on V2021 NIM Estimates V2021 would have used 2020 ACS to produce estimates Data quality concerns Data lag (July 1, 2021 estimate using calendar year 2020 data) 2020 ACS produced higher levels of immigration through the measurement/reference period (July 1, 2020 to June 30, 2021) than expected For V2021 we decided the 2020 ACS was not a good fit for our purposes, and instead adjusted 2019 ACS data based on trends seen in administrative data between 2019 and 2021 Needed to make full-year adjustments using more recent administrative data 19
Benchmark Database Benchmark Database U.S. consulate closures PEP developed the Benchmark Database, which compiles published statistics from various agencies to forecast NIM for the COVID-19 period (three examples shown here) Use of published statistics can be more timely than inter-agency data exchange. One-year data lag is reduced to one month in some cases However, there are limitations: Published statistics are intended to be administrative metrics, not migration measures Confounds mobility for migration. Requires subject matter expertise to carefully evaluate for fitness of use Only available as national aggregate statistics missing students flight reductions Data Sources: U.S. State Department, U.S. Bureau of Consular Affairs; Bureau of Transportation Statistics 20
Benchmark Components of Foreign Benchmark Components of Foreign- -Born Immigration Born Immigration Compiled 10 benchmark components of foreign-born movement to the U.S. Not an exhaustive list but covers most categories of the foreign born who reside in the U.S. most of the year PEP Benchmarks and PEP trend similarly. Benchmarks surpass PEP immigration levels partially due to increased asylees Benchmarks reflect the 1 July - 30 June reference period used by PEP. COVID-19 affects the last quarter of the 2020 reference period and all of 2021 2020 PEP is a COVID-19 projection of 2019 ACS data based on adjustment method shown previously 2021 PEP is the standard projection assumption, which was not plausible given COVID-19 impacted all of 2021 Data Sources: U.S. Census Bureau, Vintage 2020 Population Estimates-Foreign-Born Immigration Component; U.S. State Department, Bureau of Consular Affairs; Institute of International Education; Refugee Processing Center; U.S. Citizenship and Immigration Services (USCIS); U.S. Department of Justice 3
Benchmark Series of Foreign Benchmark Series of Foreign- -Born Immigration Born Immigration Emphasizes comparison of annual trends instead of absolute numbers For 2021, the benchmark is used to develop a plausible range of immigration trajectories Low benchmark is restricted to immigrants and refugees only. PEP theoretically should never fall below this series totals High benchmark combines all components from the previous slide. Heavily influenced by surge in asylees since 2014; however, many asylees might be outside the U.S. or appear in prior visa data Middle benchmark combines immigrants, students, labor migrants, refugees, and affirmative asylees (used to make adjustment) PEP Data Sources: U.S. Census Bureau, Vintage 2020 Population Estimates and Migration Benchmark Database (Internal Use) 22
NIM Estimates NIM Estimates 2019 was the last year in which non-adjusted ACS data were used for PEP Standard projection method assumes that 2019 patterns continue for 2020 2020 COVID-19 projection based on public data and special tabulations from BTS, OIS, and Statistics Canada Standard Projection 2021 COVID-19 projection is the ratio of 2021 to 2019 Middle benchmark totals applied to the 2019 PEP total to project 2021 PEP Net air passenger totals, in conjunction with ACS/PRCS, used for the 2021 PEP estimate of U.S. and Puerto Rico migration COVID-19 Projection Data Sources: U.S. Census Bureau, Vintage 2020 & 2021 Population Estimates-Net International Migration. Internal File 23
Did V2022 need adjustment? Benchmark Immigration Components through 2022 2500 x1000 NTA/NTR 2000 Def. Asylum Aff. Asylum Ukrainian 1500 Afghan Refugee L H4 1000 H2B H1B F2 500 IIE Student LPR Immig PEP 0 2010 2011 2012 2013 2014 2015 2016 Data Year 2017 2018 2019 2020 2021 2022* Some months projected for 2022 Data Sources: State Dept-Bureau of Consular Affairs, State Dept-Refugee Processing Center, Institute of International Education, U.S. Citizenship and Immigration Services (USCIS), Justice Dept, Executive Office for Immigration Review, and U.S. Border Patrol
Alternative Data Sources Alternative Data Sources Other migration data collected in the Federal system Not always current and problems with data access Data sharing agreements BTS (early access to flight data) USCIS (lawful permanent residence file) in progress (files through 2016 available) Health and Human Services (refugee information) in progress Leverage through data linkage Development of the Integrated Database on International Migration (IDIM) Linkage of Social Security, IRS, and ACS data (so far) Developing new methodology for emigration rates using longitudinal IRS data 25
U.S. Administrative Data Sources on .S. Administrative Data Sources on International Migration International Migration Internal Revenue Service Citizenship and Immigration Services Customs and Border Protection Immigration and Customs Enforcement Bureau of Transportation Statistics Social Security Administration Department of State Department of Justice Numident Lawful Permanent Resident (LPR) Federal Tax Exemptions Airline Passenger Data Visa Statistics Age Sex Country of Birth Implied Year of Entry Year Visa Issued Country Visa Class Movement Subnational totals Class of Admission Country of Birth/ Citizenship Demographic Characteristics Year of Status Change Entries Exits Student and Exchange Visitor Information System (SEVIS) Arrival and Departure Information System (ADIS) Defensive Asylee Statistics Individual Tax ID Number (ITIN) Land Border Crossing Data Worldwide Refugee Admissions Processing System (WRAPS) Entries Only Movement Implied non- citizenship Implied Year of Entry Affirmative Asylee Statistics In use Needs processing Not acquired 26
Discussion Discussion Use of current, publicly available statistics on international mobility combined with the ACS Emphasis on projecting trends, not comparing levels between the estimates and benchmark data Example of macro-data integration where aggregate data from multiple sources are combined to produce a single estimate The IDIM is an example of microlevel integration, using individual-level and internal- use federal administrative data to measure migration by subnational geographic and demographic detail 27
The Future The Future Data Integration will become an important feature of international migration statistics Draw upon the strengths of each data source, mitigating their weaknesses U.S. Census Bureau will continue to pursue these avenues of research, including greater incorporation of administrative data, as household survey-based estimates become less tenable (data privacy adjustments, increased non-response, especially by foreign-born respondents) Non-traditional data sources will likely need to be incorporated as well 28
