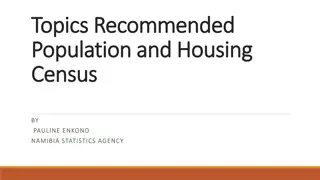
International Migration Trends Analysis Using Census Data
The session focused on utilizing census data to analyze international migration trends, emphasizing the importance of strengthening data collection and usage for development. Key points discussed include data availability since the 2010 census round, South-South migration statistics, migrant stock as a percentage of the total population, regional migration patterns, demographics of young migrants, and the proportion of refugees in the international migrant stock. The presentation highlighted the significance of understanding and tracking migration patterns for policy-making and development efforts.

Download Presentation

Please find below an Image/Link to download the presentation.
The content on the website is provided AS IS for your information and personal use only. It may not be sold, licensed, or shared on other websites without obtaining consent from the author.If you encounter any issues during the download, it is possible that the publisher has removed the file from their server.
You are allowed to download the files provided on this website for personal or commercial use, subject to the condition that they are used lawfully. All files are the property of their respective owners.
The content on the website is provided AS IS for your information and personal use only. It may not be sold, licensed, or shared on other websites without obtaining consent from the author.
E N D
Presentation Transcript
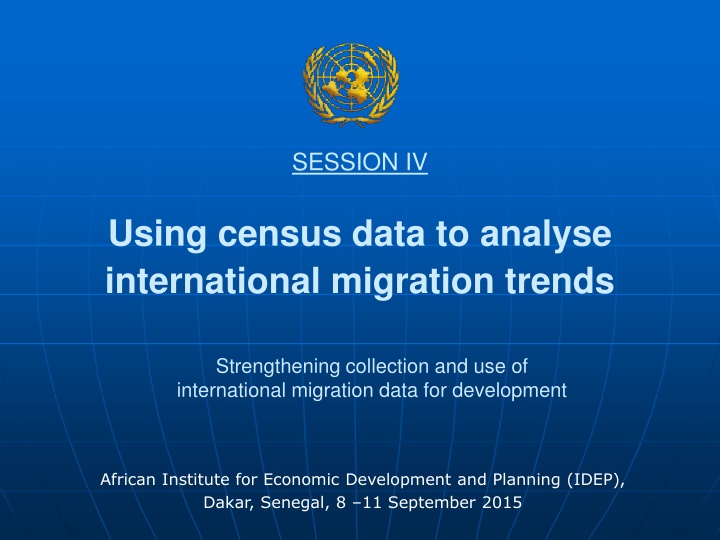
SESSION IV Using census data to analyse international migration trends Strengthening collection and use of international migration data for development African Institute for Economic Development and Planning (IDEP), Dakar, Senegal, 8 11 September 2015
Data availability from 2010 census round Percentage of countries with data on sex, age and origin since 2010 census round 100 90 80 70 60 50 40 30 20 10 0 Africa Asia Europe LatinAmerica &Caribbean Northern America Oceania Total & Sex Age Origin Source: Trends in International Migrant Stock: The 2015 Revision
South-South migration is as common as South-North migration International migrant stock, 2013 (millions) North North 53.7 million (23%) 13.7 million (6%) 81.9million (35%) South 2013 82.3 million (36%) South Source: Trends in International Migrant Stock: The 2013 Revision United Nations, Population Division/DESA
Migrant stock as percentage over total population in Africa (1990-2015) International migrant stock, 1990-2015 (millions) Proportion of international migrants in total population 25 20 20 17 16 16 15 2.5% 1.9% 1.6% 1.7% 10 5 0 1990 2000 2010 2015 United Nations, Population Division/DESA
About 80% of migrants in A are from A About 50% of migrants from A live in A Africa as destination Africa as source 82 49 Region of birth region of destination Region of birth = region of destination United Nations, Population Division/DESA
The proportion of young migrants (<20) among all migrants is highest in Africa Migrant stock under age 20, 2013 (percentage) United Nations, Population Division/DESA Source: Trends in International Migrant Stock: The 2013 Revision
Refugees as a percentage of the international migrant stock - 2013 More than 30 per cent Between 5 and 30 per cent Less than 5 per cent Source: Trends in International Migrant Stock: The 2013 Revision
One in every nine tertiary educated persons born in Africa resides in OECD countries Source: UN-DESA and OECD, 2013. World Migration in Figures
Senegal as origin - 2013 1 to 1,000 1,000 to 10,000 More than 10,000
Changes in the stock of migrants 2005-2010 (Africa) 2005 2010 16,358 17,125 Migrant stock in Africa ( 000) 65+ 65+ 60-64 F - 2005 60-64 F - 2010 55-59 55-59 M - 2005 M - 2010 50-54 50-54 45-49 45-49 40-44 40-44 35-39 35-39 30-34 30-34 25-29 25-29 20-24 20-24 15-19 15-19 10-14 10-14 5-9 5-9 0-4 0-4 -1000 -500 0 500 1000 -1,000 -500 0 500 1,000
Cohort analysis of international migrants in Africa thousands Percent International migrant stock 2005 Deaths during 2005-2010 Returns based on age distribution Gross change during 2005-2010 New migrants during period Stock 2010 16,358 906 5,728 767 7,401 17,125 35.0 4.7 45.2
Data availability Latest available data (to Population Division) Country Census dates Algeria Census 1987, 1998, 2008 No data Benin Census 1992, 2002, 2013 Latest available data from 2002 Latest available data from 2006 (no data on origin) Burkina Faso Census 1996, 2006 C te d'Ivoire Census 1988, 1998, 2014 Latest available data from 1998 Latest available data from 2006 (no data on origin) Libyan Arab Jamahiriya Census 1995, 2006 Mali Census 1987, 1998, 2009 Latest available data from 2009 Mauritania Census 1988, 2000, 2013 Latest available data from 2000 Morocco Census 1994, 2004, 2014 Latest available data from 2014 Niger Census 1988, 2001, 2012 Latest available data from 2001 Latest available data from 2013 (no data on origin) Senegal Census 1988, 2002, 2013 Togo Census 1981, 2010 Latest available data from 2010
International migrant stock summary for 11 participating countries, 2015 1990 1995 2000 2005 2010 2015 International migrants (x 1,000) 3,771 4,238 4,257 4,587 5,037 5,458 Refugees (x 1,000) 443 684 350 199 214 349 Refugees (%) 11.7 16.1 8.2 4.3 4.3 6.4 Female (%) 46.5 45.9 45.1 44.3 44.3 44.3
Origin of international migrants by major area 2013 (in participating countries) 5% 2% Africa Asia Europe LAC N. America Oceania Other 13% 80%
Destination for international migrants 2013 (from participating countries) 2% Africa Asia Europe 48% 47% Latin America and the Caribbean Northern America Oceania 3%
International migrants in Europe by major area of origin (rev. 2013) 1.30.42.0 Africa 12.1 Asia 6.2 Europe Latin America and the Caribbean Northern America 25.7 52.3 Oceania Others
Changes in working age population (15-59) and youth (15-29), 2015 - 2050


")