Fiscal Year 2018 Budget Workshop Overview
This document outlines the schedule and key activities for the Fiscal Year 2018 budget workshop, including quarterly reviews, presentations, budget preparations, fund accounting, and revenue discussions. It covers topics such as special revenue funds, CDBG grant fund budget, police education fund budget, and specialized training funding for the Sheriff's Office.
Download Presentation

Please find below an Image/Link to download the presentation.
The content on the website is provided AS IS for your information and personal use only. It may not be sold, licensed, or shared on other websites without obtaining consent from the author.If you encounter any issues during the download, it is possible that the publisher has removed the file from their server.
You are allowed to download the files provided on this website for personal or commercial use, subject to the condition that they are used lawfully. All files are the property of their respective owners.
The content on the website is provided AS IS for your information and personal use only. It may not be sold, licensed, or shared on other websites without obtaining consent from the author.
E N D
Presentation Transcript
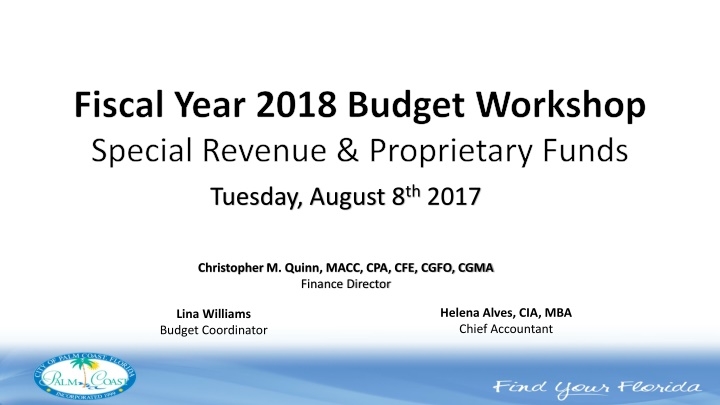
Fiscal Year 2018 Budget Workshop Special Revenue & Proprietary Funds Tuesday, August 8th 2017 Christopher M. Quinn, MACC, CPA, CFE, CGFO, CGMA Finance Director Helena Alves, CIA, MBA Chief Accountant Lina Williams Budget Coordinator
January - March First Quarter Review Annual Financial Audit Presentation of Annual Progress Report Survey Results to City Council Annual Update of the Strategic Action Plan April Revise 10 Year Infrastructure Plan Year to Date Budget Results Presentation Fund Accounting & Revenue Presentation Second Quarter Review Departments Begin FY 2018 Budget Preparation
May June Long Term Financial Planning Presentation Property Tax Review Presentation July - August General Fund Budget Workshop Adopt Maximum Millage Rate (August 4th deadline) Third Quarter Review Capital Funds Budget Workshop Special Revenue & Proprietary Funds Budget Workshop Final Proposed Budget Presentation
September Public Hearing to Adopt Tentative Millage Rate & Budget Public Hearing to Adopt Final Millage Rate & Budget October December FY 2017 Close-out End of Year Review with Departments
CDBG Grant Fund Budget 2017 Estimated 2017 *Budget 2018 Change 2017-2018 Percentage Change CDBG Entitlement Grant 979,900 505,540 1,062,981 83,081 8.48% Total Revenues 979,900 505,540 1,062,981 83,081 8.48% Total Expenditures 979,900 505,540 1,062,981 83,081 8.48% *2018 Expenditures Owner Occupied Housing Rehab Seminole Woods Path Public Service Administration $391,734 $606,212 $50,035 $15,000
Police Education Fund Budget Estimated Budget 2017 2017 5,000 4,750 9,035 5,250 14,035 10,000 Change 2017-2018 (6,035) (6,285) Percentage Change -5.00% -66.80% -44.78% 2018 4,750 3,000 7,750 Revenues Appropriated fund balance Total Revenues (250) Expenditures Contingency Total Expenditures 10,000 4,035 14,035 10,000 10,000 7,750 7,750 (2,250) (4,035) (6,285) -22.50% -100.00% -44.78% - - Advanced & Specialized Training Advanced & Specialized Training These funds will be used for the purpose of conducting advanced and specialized training for the members of the Sheriff s Office law enforcement services.
Disaster Reserve Fund Budget 2017 2,212,265 Estimated 2017 2,901,200 Budget 2018 Change 2017-2018 (2,212,265) Percentage Change -100.00% Revenues - Expenditures 2,212,265 2,901,200 - (2,212,265) -100.00% Disaster Reserve Fund Balance Policy Disaster Reserve Fund Balance Policy The Disaster Reserve can be used to address unanticipated expenditures arising out of a hurricane, tornado, other major weather related events, and/or other massive infrastructure failures or other disasters, whether man-made or caused by nature, using emergency procedures as provided for in the City's Purchasing Policy.
Special Events Fund Budget 2017 Estimated 2017 Budget 2018 Change 2017-2018 Percentage Change Revenues: Recycling Revenue Grants Charges for Services Interest Appropriated Fund Balance Total Revenues 50,000 20,000 55,675 39,785 165,460 58,000 20,000 36,692 1,200 41,794 157,686 100,000 20,000 58,545 178,545 50,000 2,870 (39,785) 13,085 100.00% 0.00% 5.15% -100.00% 7.91% - - - - - - Expenditures: Total Expenditures 165,460 157,686 178,545 13,085 7.91% 2018 Special Events: Starlight Event & Parade, Arbor Day, Fireworks in the Park, Hall of Terror, Food Truck Tuesdays, CHIRP, Christmas Tree Recycling, Birds of a Feather, Waterway Cleanup
NSP Grant Fund Budget 2017 16,407 16,407 Estimated Budget 2017 24,732 - 24,732 Change 2017-2018 (16,407) (16,407) Percentage Change -100.00% -100.0% 2018 Program Income Appr. Fund Bal. - - - - - - Total Revenue Operating Expenditures Reserves Total Expenditures 16,407 16,407 - 23,385 1,347 24,732 - - - (16,407) (16,407) - -100.00% -100.0% -
BAC Fund Budget Estimated Budget 2017 2017 5,000 5,000 33,630 33,630 38,630 38,630 Change 2017-2018 (22,130) (22,130) Percentage Change 0.00% -65.80% -57.29% 2018 5,000 11,500 16,500 Charges for Services Appropriated Fund Balance Total Revenues - Operating Expenditures Commercial Attraction Strategy Reserve Total Expenditures 5,000 22,500 11,130 38,630 5,000 22,500 11,130 38,630 5,000 11,500 16,500 (22,500) (22,130) - 0.00% - -100.00% 3.32% -57.29% 370
Health Insurance Fund Budget 2017 4,551,750 25,000 4,000 4,580,750 Estimated 2017 4,551,750 14,000 4,565,750 Budget 2018 4,646,752 16,000 4,662,752 Change 2017-2018 95,002 (25,000) 12,000 82,002 Percentage Change 2.09% -100.00% 300.00% 1.79% Premium Charges BCBS Wellness Grant Interest Total Revenues - - Expenditures 4,580,750 4,565,750 4,662,752 82,002 1.79%
Fleet Fund Budget 2017 3,371,048 850,940 18,000 20,000 150,000 207,000 4,616,988 Estimated 2017 3,371,048 609,250 22,000 30,000 20,000 390,000 190,852 4,633,150 Budget 2018 3,607,987 760,100 24,000 25,000 20,000 200,000 327,300 4,964,387 Change 2017-2018 236,939 (90,840) 6,000 25,000 50,000 120,300 347,399 Percentage Change 7.0% -10.7% 33.3% 100.0% 0.0% 33.3% 58.1% 7.5% Internal Charges Internal Fuel Charges External Fuel Charges Interest Insurance Settlements Auction Proceeds Transfers for New Equipment - - Total Revenues Operating Expenditures Capital Outlay Replacement Reserves 2,205,842 2,324,500 86,646 4,616,988 1,963,762 2,202,135 467,253 4,633,150 2,169,381 2,007,900 787,106 4,964,387 (36,461) (316,600) 700,460 347,399 -1.7% -13.6% 808.4% 7.5% Total Expenditures
Fleet Fund Capital Improvement Plan FY 17 Projected FY 18 FY 19 FY 20 FY 21 FY 22 Expenditures: Operating Expenditures 2,431,015 2,956,487 3,074,746 3,197,736 3,325,646 3,458,672 Fleet Replacements New Equipment 1,981,283 220,852 1,433,100 574,800 2,850,000 2,850,000 2,850,000 2,850,000 - - - - Total Expenditures 4,633,150 4,964,387 5,924,746 6,047,736 6,175,646 6,308,672 As of 8/3/17: Amount of total Fleet on the Books: $19,994,747 Average Life $2,856,392 7 Estimated Annual Replacement
Fleet Fund FY 2018 Capital Expenditures New Equipment Replacements Parks & Recreation: F150 $22,000 White Fleet Mowers/Mower Decks/Utility vehicles Heavy Equipment Golf Carts Commercial Fire Truck (deposit) Upgrade Lowboy Total Replacements $426,900 $382,600 $329,600 $200,000 $50,000 $44,000 $1,433,100 Streets & Parks Maintenance: 4500 Crew Cab w/Landscape Body (new crew) John Deere Tractor w/Loader $54,000 $37,500 $69,500 $19,800 Groundmaster 4000 Toro Workman Utility: F150 (WWTP 2) $27,600 $7,600 $38,500 $24,000 John Deere Gator (WWTP 2) F350 (Util. Maint., New Position) Frontier King Cab (Distribution, New Position) Community Development: F150 (New Building Inspector) Frontier King Cab 4x4 (CM&E, New Position) Multi-Departmental Use: $27,800 $26,000 Grapple Truck $220,500 Total New $574,800 Total Capital Expenditures $2,007,900
Facilities Maintenance Fund Budget Change 2017-2018 58,556 58,556 Budget 2017 620,043 620,043 Estimated 2017 620,043 620,643 Budget 2018 678,599 678,599 Percentage Change 9.4% 0.0% 9.4% Internal Service Charges Interest Total Revenues - 600 - - Operating Expenditures Replacement Reserves Total Expenditures 579,196 40,847 620,043 575,461 45,182 620,643 627,922 50,677 678,599 48,726 9,830 58,556 8.4% 24.1% 9.4%
Communications Fund Budget Change 2017-2018 12,000 12,000 Budget 2017 275,400 12,000 6,000 293,400 Estimated 2017 275,400 12,000 6,000 293,400 Budget 2018 275,400 24,000 6,000 305,400 Percentage Change 0.0% 100.0% 0.0% 4.1% Internal Service Charges Transfer for New Radios Interest Total Revenues - - Operating Expenditures Replacement Reserves Total Expenditures 28,000 265,400 293,400 20,000 273,400 293,400 44,000 261,400 305,400 16,000 (4,000) 12,000 57.1% -1.5% 4.1%
Solid Waste Fund Budget *Change 2017-2018 830,494 Budget 2017 7,537,466 Estimated 2017 7,803,217 Budget 2018 8,367,960 Percentage Change 11.02% Total Revenues Total Expenditures 7,537,466 7,803,217 8,367,960 830,494 11.02% *New contract effective June 2017
Information Technology Fund Budget 2017 Internal Service Charges 1,742,100 Charges for Services 587,440 Appropriated Fund Balance Total Revenues 2,329,540 Estimated 2017 1,742,100 561,330 2,303,430 Budget 2018 2,107,594 528,000 108,053 2,743,647 *Change 2017-2018 365,494 (59,440) 108,053 414,107 Percentage Change 21.0% -10.1% 17.8% - - - Operating Expenditures Capital Outlay Subtotal 2,185,540 144,000 2,329,540 2,181,942 121,488 2,303,430 2,571,147 172,500 2,743,647 385,607 28,500 414,107 17.6% 19.8% 18% *Fiber Study Included Change *2017-2018 2 Percentage Change 18.2% 2017 11 2018 13 Personnel (FTE) *Applications Analyst & GIS Tech
Building Permits Fund Budget 2017 Estimated 2017 Budget 2018 Change 2017-2018 Percentage Change Permits, Fees and Miscellaneous Interest Total Revenues 1,731,650 1,731,650 2,318,000 14,000 2,332,000 2,318,000 15,000 2,333,000 586,350 15,000 601,350 33.9% 100.0% 34.7% - Operating Expenditures Reserves Total Expenditures 1,718,050 13,600 1,731,650 1,763,694 568,306 2,332,000 1,861,675 471,325 2,333,000 143,625 457,725 601,350 8.4% 3365.6% 34.7% *Change 2017-2018 1.00 Percentage Change 2017 16.55 2018 17.55 Personnel (FTE) 6.0% *Building Inspector
Utility Fund Budget Estimated 2017 2017 36,513,099 40,705,342 Budget 2018 41,267,034 Change 2017-2018 4,753,935 Percentage Change 13.0% Total Revenues Customer Service Administration Wastewater Operations Water Operations Non-Departmental* Subtotal 1,479,203 848,423 5,860,099 8,779,662 18,016,320 34,983,707 1,473,817 845,178 5,829,819 8,785,279 20,942,458 37,876,551 1,586,297 860,149 6,615,613 9,742,136 20,037,153 38,841,348 107,094 11,726 755,514 962,474 2,020,833 3,857,641 7.2% 1.4% 12.9% 11.0% 11.2% 11.0% Capital Reserve Total Expenditures 1,529,392 36,513,099 2,828,791 40,705,342 2,425,686 41,267,034 896,294 4,753,935 58.6% 13.0% *Includes transfer of reserves to Utility Capital Projects Fund (FY 17E $2.5M & FY18B $1.5M) Actual 2017 124.00 Proposed 2018 126.50 *Change 2017-2018 2.5 Personnel (FTE) * NEW - PT Admin. Assistant, Meter Foreman, Mechanical Technician
Stormwater Fund Budget 2017 7,240,846 418,442 335,000 7,994,288 Estimated 2017 7,240,846 418,442 10,000 335,000 8,004,288 Budget 2018 7,270,000 502,590 700,000 278,956 8,751,546 Change 2017-2018 29,154 84,148 365,000 278,956 757,258 Percentage Change Charges for Services Ad Valorem Taxes Interest SJRWMD Grant Appropriated Fund Balance Total Revenues 0.4% 20.1% - 109.0% 100.0% 9.5% - - - - - Operating Expenses Projects New Equipment Debt Service Reserves Total Expenditures 3,259,536 3,097,566 42,000 1,361,275 233,911 7,994,288 3,270,724 2,994,316 38,796 1,356,275 344,177 8,004,288 3,341,327 4,050,311 1,359,908 8,751,546 81,791 952,745 (42,000) (1,367) (233,911) 757,258 2.5% 30.8% -100.0% -0.1% -100.0% 9.5% - -
August 29th September 6thPublic Hearing to adopt tentative millage rate and budget September 20thFinal Public Hearing to adopt final millage rate and budget Final Proposed Budget Presentation
