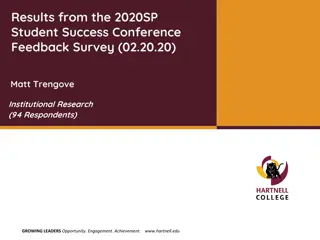
Employee Feedback Survey Analysis and Insights
This detailed report outlines the process and findings of an employee feedback survey conducted in July and August 2012. The survey aimed to gather feedback from classified and exempt employees, with a focus on assessing satisfaction levels and identifying top priorities across various aspects such as healthcare, governance, compensation, communication, and more. The analysis comprises both qualitative and quantitative components, providing valuable insights to inform organizational decision-making and enhance employee satisfaction.

Download Presentation

Please find below an Image/Link to download the presentation.
The content on the website is provided AS IS for your information and personal use only. It may not be sold, licensed, or shared on other websites without obtaining consent from the author.If you encounter any issues during the download, it is possible that the publisher has removed the file from their server.
You are allowed to download the files provided on this website for personal or commercial use, subject to the condition that they are used lawfully. All files are the property of their respective owners.
The content on the website is provided AS IS for your information and personal use only. It may not be sold, licensed, or shared on other websites without obtaining consent from the author.
E N D
Presentation Transcript
Survey objectives and conception: Solicit employee feedback to generate agendas Use data to inform the governance process Approvals: Office of Research & Graduate Studies (exempt from IRB) Executive leadership at UAA Administration
Criteria: Brief Qualitative and quantitative components Assess satisfaction and ascertain priorities 13 items rated on a 1-5 LickertScale Employees select top 3 priorities from the same list Free responses
July & August, 2012 administration Invitation to participate sent out via dynamic listserv to all classified and exempt employees Approximately 1300 353 responses 27% response rate
Quantitative analysis: Metrics of central tendency T-test analyses Qualitative analysis: Categorical identification Inform and give meaning to the quantitative findings
5.00 4.00 3.00 2.00 1.00 0.00
4.50 4.00 3.50 3.00 2.50 2.00 1.50 Classified 1.00 Exempt 0.50 0.00
600 500 400 300 200 100 0
30.00% 25.00% 20.00% 15.00% 10.00% Classified 5.00% Exempt 0.00%
SATISFACTION RATING (LOW TO HIGH) PRIORITY RANKING (HIGH TO LOW) Healthcare Parking Governance & I. Decision- Making Compensation Communication Professional Development Facilities Workplace Culture Diversity Retirement Leave Benefits Safety Tuition Waiver Healthcare Compensation Workplace Culture Communication Governance & I. Decision- Making Professional Development Retirement Leave Benefits Tuition Waiver Safety Parking Diversity Facilities
Healthcare Satisfied with plan, dissatisfied with cost Cost increases disproportionate to salary adjustments Ongoing support for wellness programs Compensation Request for merit and step increases Clear process to audit jobs to ensure appropriate grade assignments Professional development Mentoring Increased opportunities Inter-departmental communication and exchanges
Communication Better communication between MAUs and community campuses Transparency from administration and governance Direct communication from administration rather than trickling down through Deans & Directors Ongoing opportunities to participate in surveys Leave benefits Request to combine annual and sick leave Additional cash-in options Parking Cost Space
Unbiased /external grievance process Supervisor evaluations Changes to leave accrual and cash-out options Workload & staffing
Agenda development & planning Ongoing communication With staff With administration Between campuses & departments Continued assessment