Data Visualization: Enhancing Decision-Making and Collaboration


Tell me what you see:
Creating a graphical tool
for others


Data Prep

Analyze

Share in
Meeting

PPT

Data Prep

Analyze


Create Data
Viz Tool and
Share

Create PPT

Analyze /
Collaborate

Decision /
Action


Decision /
Action


PPT

PPT


Several re-analysis / PPT cycles
Only people in the meeting weigh in
Get the data viz tool in the hands of
collaborators faster so everyone can
advance the project

PPT


Tablet Dissolution Problem
Scrapping 15% of
batches due to
non-conformance
to release
specification
Data
Visualization
as a Tool for
Others
Inputs to
Making a
Data Viz Tool
1.
What decision(s) do we/others have to
make?
•
What question(s) do we/others need to answer?
•
What are the
series
of questions others will ask?
2.
What actions can be taken? (And/or what
actions
cannot
be taken?)
3.
What supporting evidence do we/others
want to see?
4.
What else will we/others want to know
about the problem?
What decision(s) do we/others
have to make?
•
What question(s) do we/others
need to answer?
•
What are the series of questions
will others will ask?
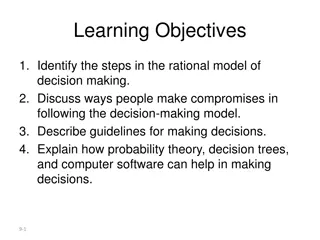
1.
Identify factors that are correlated
with Dissolution.
2.
How
do I change these factors to
improve Tablet Dissolution?
Model profiler
with
recommended settings
What actions can be taken?
(And/or what actions
cannot
be
taken?)
What supporting evidence do
we/others want to see?
What else will we/others want
to know about the problem?
Adjust factors – except screen size
Correlations showing univariate
relationships
Do the results change with
certain batches excluded?
Model profiler
with
recommended settings
for each
screen size
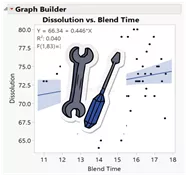
Graph Builder with univariate
correlations
with each process factor
(
Column Switcher
) and dissolution
split (X grouping) by Screen Size
Data filter
on batch ID
Label
on batch ID
Question
Answer
Data Viz
1
2
3
4
Next time
you do an
analysis…
Think about getting the data / analysis in
the hands of others in the form of a
Data Viz Tool
sooner rather than later
instead of a PPT to be shared in a
meeting
Energy Cost Problem
•
Energy bill has been
increasing
•
Employee complaints
have been increasing
What decision(s) do we/others
have to make?
•
What question(s) do we/others
need to answer?
•
What are the series of questions
will others will ask?
What actions can be taken?
(And/or what actions
cannot
be
taken?)
What supporting evidence do
we/others want to see?
What else will we/others want
to know about the problem?
1.
Is the HVAC system working
properly?
2.
Which rooms have had large
deviations from the set point?
3.
When did the deviations occur?
4.
Which units control those rooms?
5.
Who was the engineer on shift?
•
Check units
•
Call engineer
•
Room temperature by hour
•
External temperature by
hour
What room type and location
did the deviations occur in?
•
Building heat map
showing deviations
•
Drill-down
showing
time series of
deviations
•
Label
showing VAV unit
and engineer
Label
showing VAV unit and
engineer
Room temp and external
temp
time series
Label
showing room type
and location type (internal /
external)
1
2
3
4
Question
Answer
Data Viz
Transform your data analysis processes with graphical tools that facilitate decision-making, collaboration, and problem-solving. Explore key questions, actions, evidence, and insights to drive effective outcomes. Empower experts and stakeholders to leverage data visualizations for strategic decision support and hypothesis testing.

Download Presentation

Please find below an Image/Link to download the presentation.
The content on the website is provided AS IS for your information and personal use only. It may not be sold, licensed, or shared on other websites without obtaining consent from the author. Download presentation by click this link. If you encounter any issues during the download, it is possible that the publisher has removed the file from their server.
E N D
Presentation Transcript
Tell me what you see: Creating a graphical tool for others
Several re-analysis / PPT cycles Decision / Action Share in Meeting Data Prep Analyze Create PPT PPT PPT PPT PPT Only people in the meeting weigh in Create Data Viz Tool and Share Analyze / Collaborate Decision / Action Data Prep Analyze Get the data viz tool in the hands of collaborators faster so everyone can advance the project
Tablet Dissolution Problem Scrapping 15% of batches due to non-conformance to release specification
Give other experts and collaborators the ability to explore the data freely and ask / answer questions Data Visualization as a Tool for Others Facilitate identification of issues and taking action by those on the ground Guide stakeholders in making a sound decision Facilitate a discussion with collaborators to test hypotheses and develop new ones
1. What decision(s) do we/others have to make? What question(s) do we/others need to answer? What are the series of questions others will ask? 2. What actions can be taken? (And/or what actions cannot be taken?) 3. What supporting evidence do we/others want to see? 4. What else will we/others want to know about the problem? Inputs to Making a Data Viz Tool
Question Answer Data Viz 1. Identify factors that are correlated with Dissolution. 2. How do I change these factors to improve Tablet Dissolution? Model profiler with recommended settings What decision(s) do we/others have to make? What question(s) do we/others need to answer? What are the series of questions will others will ask? 1 Adjust factors except screen size Model profiler with recommended settings for each screen size 2 What actions can be taken? (And/or what actions cannot be taken?) Correlations showing univariate relationships Graph Builder with univariate correlations with each process factor (Column Switcher) and dissolution split (X grouping) by Screen Size What supporting evidence do we/others want to see? 3 Do the results change with certain batches excluded? Data filter on batch ID Label on batch ID What else will we/others want to know about the problem? 4
Think about getting the data / analysis in the hands of others in the form of a Data Viz Tool sooner rather than later instead of a PPT to be shared in a meeting Next time you do an analysis
Energy Cost Problem Energy bill has been increasing Employee complaints have been increasing
Question Answer Data Viz Building heat map showing deviations Drill-down showing time series of deviations Label showing VAV unit and engineer 1. Is the HVAC system working properly? 2. Which rooms have had large deviations from the set point? 3. When did the deviations occur? 4. Which units control those rooms? 5. Who was the engineer on shift? What decision(s) do we/others have to make? What question(s) do we/others need to answer? What are the series of questions will others will ask? 1 2 Check units Call engineer Label showing VAV unit and engineer What actions can be taken? (And/or what actions cannot be taken?) Room temperature by hour External temperature by hour Room temp and external temp time series What supporting evidence do we/others want to see? 3 What room type and location did the deviations occur in? Label showing room type and location type (internal / external) What else will we/others want to know about the problem? 4


 do we/others have to")