Arrays and Groups in Multiplication
Explore the concept of grouping items in arrays for multiplication through visual representations. Learn to count items in equal groups, write addition sentences, and connect to Common Core standards. Engage students in discussions about organizing and counting dots in arrays to enhance mathematical understanding.

Download Presentation

Please find below an Image/Link to download the presentation.
The content on the website is provided AS IS for your information and personal use only. It may not be sold, licensed, or shared on other websites without obtaining consent from the author.If you encounter any issues during the download, it is possible that the publisher has removed the file from their server.
You are allowed to download the files provided on this website for personal or commercial use, subject to the condition that they are used lawfully. All files are the property of their respective owners.
The content on the website is provided AS IS for your information and personal use only. It may not be sold, licensed, or shared on other websites without obtaining consent from the author.
E N D
Presentation Transcript
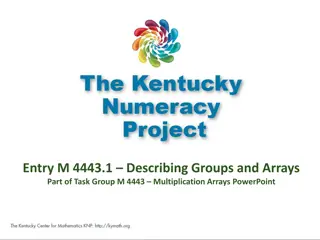
M 4443.2 Entry M 4443.2 Counting items arranged in groups and arrays Part of Task Group M 4443 Multiplication Arrays PowerPoint
M 4443.2 I can determine how many items in all when items are arranged in an array or in equal groups. I can write an addition sentence to match the picture. Click HERE to skip to first image. Click HERE to skip to first image.
M 4443.2 Connections to CCSS 2.OA.4 Use addition to find the total number of objects arranged in rectangular arrays with up to 5 rows and 5 columns; write an equation to express the total as a sum of equal addends. This activity also supports: 3.OA.1 Interpret products of whole numbers, e.g., interpret 5 x 7 as the total number of objects in 5 groups of 7 objects each. Click HERE to skip to first image. Click HERE to skip to first image.
M 4443.2 Teacher Directions Display an image, leaving the image available for students to see and discuss. Give discussion prompts such as What do you see? (Look for language that shows students are seeing the organization of the dots, i.e. groups, rows, columns, array, etc.) How are the dots organized? How can we count the dots? Show me! What s another way to count the dots? (For many of the images in the powerpoint, at least one skip counting sequence can be shown by repeatedly selecting ENTER. To omit the skip counting sequence, click on the link in the lower right corner. You may prefer to do your own recording for counting strategies using smart board tools or by writing directly on a white board. As an extension, you might ask students to consider if it s easier to count by columns or rows.) What is an addition sentence that matches this picture? (Eventually extend to asking for two addition sentences. For example, a 3 by 4 array matches 3+3+3+3=12 and 4+4+4=12.) It may be helpful to do this after the skip counting and while only the total number of dots is being displayed. Click HERE to skip to first image. Click HERE to skip to first image.
M 4443.2 Teacher Directions Technical note: The skip counts are added to the slide using animations in PowerPoint. If you want to reset an image so that the skips counts are no longer showing, or you want to show the skip counts a second time, click on the back arrow until the slide is reset. Click HERE to skip to first image. Click HERE to skip to first image.
M 4443.2 Click or push ENTER for next image
M 4443.2 M 4443.2 5 10 15 Click here for new image Click here for new image Or choose ENTER to show skip counts.
M 4443.2 Click or push ENTER for next image
M 4443.2 3 6 9 12 15 Click here for new image Click here for new image Or choose ENTER to show skip counts.
M 4443.2 Click or push ENTER for the first image
M 4443.2 We can also skip count by 6s 6 12 2 4 6 8 10 12 Click here for new image Click here for new image Or choose ENTER to show skip counts.
M 4443.2 Click or push ENTER for next image
M 4443.2 We can skip count by 2s 5 10 We can also skip count by 5s 4 8 2 6 10 Click here for new image Click here for new image Or choose ENTER to show skip counts.
M 4443.2 Click or push ENTER for the first image
M 4443.2 We can skip count by 3s 9 12 6 3 4 8 12 We can also skip count by 4s Click here for new image Click here for new image Or choose ENTER to show skip counts.
M 4443.2 Click or push ENTER for next image
M 4443.2 We can also skip count by 3s 15 3 6 9 12 We can skip count by 5s 5 10 15 Click here for new image Click here for new image Or choose ENTER to show skip counts.
M 4443.2 Click or push ENTER for next image
M 4443.2 We can skip count by 4s 5 10 15 20 20 4 8 12 16 We can also skip count by 5s Click here for new image Click here for new image Or choose ENTER to show skip counts.
M 4443.2 Click or push ENTER for next image
M 4443.2 3 What is a different way to count the cats? 6 9 12 Click here for new image Click here for new image Or choose ENTER to show skip counts.
M 4443.2 Click or push ENTER for next image
M 4443.2 5 10 Click here for new image Click here for new image Or choose ENTER to show skip counts.
M 4443.2 Click or push ENTER for next image
M 4443.2 5 What happens if we count the columns? 10 15 20 25 Click here for new image Click here for new image Or choose ENTER to show skip counts.
M 4443.2 Click or push ENTER for next image
M 4443.2 We can skip count by 2s 2 4 6 We can also skip count by 4s 8 8 4 Click here for new image Click here for new image Or choose ENTER to show skip counts.
M 4443.2 Click or push ENTER for next image
M 4443.2 3 6 9 Click here for new image Click here for new image Or choose ENTER to show skip counts.
M 4443.2 Click or push ENTER for next image
M 4443.2 We can skip count by 6s 6 We can also skip count by 3s 12 18 3 6 9 12 15 Click here for new image 18 Click here for new image Or choose ENTER to show skip counts.
M 4443.2 Click or push ENTER for next image
M 4443.2 We can skip count by 3s 3 6 We can also skip count by 5s 9 12 15 5 1015 Click here for new image Click here for new image Or choose ENTER to show skip counts.
M 4443.2 Click or push ENTER for next image
M 4443.2 How many dots?
M 4443.2 Click or push ENTER for next image
M 4443.2 How many dots?
M 4443.2 Click or push ENTER for next image
M 4443.2 How many dots?
M 4443.2 Click or push ENTER for next image
M 4443.2 How many dots?
M 4443.2 The following excerpts come from: Progressions for the Common Core State Standards in Mathematics (draft) The Common Core Standards Writing Team 29 May 2011 This document is available at: http://commoncoretools.me/2011/05/29/complete-draft-progression- for-cc-and-oa/
M 4443.2 Levels in problem representation and solution Multiplication and division problem representations and solution methods can be considered as falling within three levels related to the levels for addition and subtraction (see Appendix). Level 1 is making and counting all of the quantities involved in a multiplication or division. As before, the quantities can be represented by objects or with a diagram, but a diagram affords reflection and sharing when it is drawn on the board and explained by a student. ... 2.OA.4 focuses on using addition to find the total number of objects arranged in rectangular arrays (up to 5 by 5). Level 2 is repeated counting on by a given number, such as for 3: 3; 6; 9; 12; 15; 18; 21; 24; 27; 30. The count-bys give the running total. The number of 3s said is tracked with fingers or a visual or physical (e.g., head bobs) pattern. For 8 x 3, you know the number of 3s and count by 3 until you reach 8 of them. Page 25 main text
M 4443.2 Supporting Level 2 methods with arrays Small arrays (up to 5 x 5) support seeing and beginning to learn the Level 2 count-bys for the first five equal groups of the small numbers 2 through 5 if the running total is written to the right of each row (e.g., 3, 6, 9, 12, 15). Students may write repeated additions and then count by ones without the objects, often emphasizing each last number said for each group. Grade 3 students can be encouraged to move as early as possible from equal grouping or array models that show all of the quantities to similar representations using diagrams that show relationships of numbers because diagrams are faster and less error-prone and support methods at Level 2 and Level 3. Some demonstrations of methods or of properties may need to fall back to initially showing all quantities along with a diagram. (side box page 25)
M 4443.2 Thank You! Please visit www.kymath.org for more information.