Understanding Venn Diagrams for Sorting Shapes
A Venn diagram, composed of overlapping circles, is a useful tool for sorting objects, numbers, or shapes. This visual aid helps in categorizing shapes based on their attributes like color, sides, and properties. Through a series of interactive examples, learn how to correctly place shapes within a Venn diagram based on specific criteria such as color, sides, and other distinguishing features.
Download Presentation

Please find below an Image/Link to download the presentation.
The content on the website is provided AS IS for your information and personal use only. It may not be sold, licensed, or shared on other websites without obtaining consent from the author. Download presentation by click this link. If you encounter any issues during the download, it is possible that the publisher has removed the file from their server.
E N D
Presentation Transcript
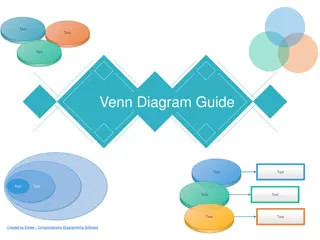
What is a Venn Diagram? A Venn diagram is made up of two circles that overlap. It can be used to sort objects, numbers or shapes.
Sorting 2D Shapes The blue rectangle fits in both parts of the diagram so needs to go in the middle of the diagram. The blue circle needs to be in the part for blue shapes. The red triangle is not blue and does not have four sides so it needs to stay out of both parts of the diagram. blue has four sides The red square needs to be in the part for four-sided shapes.
Where do these shapes need to move to? The blue rectangle does not fit in this diagram so it stays on the outside. The red triangle needs to be in the part for three-sided shapes. has three sides yellow The yellow triangle needs to be in both parts of the diagram so goes in the middle. The yellow circle needs to be in the part for yellow shapes.
Where do these shapes need to move to? Discuss with a partner. blue has curved sides
Where do these shapes need to move to? Discuss with a partner. has three or more sides purple
Where do these shapes need to move to? Discuss with a partner. is a quadrilateral green


