Understanding Fishbone Diagrams: A Visual Problem-Solving Tool
Learn about the Fishbone Diagram, also known as the Cause and Effect Diagram, its purpose, construction, and how it helps in identifying and analyzing the root causes of a problem through a structured approach. This visual tool aids in brainstorming ideas, categorizing causes, and understanding the relationships between different factors leading to an effect or issue.

Download Presentation

Please find below an Image/Link to download the presentation.
The content on the website is provided AS IS for your information and personal use only. It may not be sold, licensed, or shared on other websites without obtaining consent from the author. Download presentation by click this link. If you encounter any issues during the download, it is possible that the publisher has removed the file from their server.
E N D
Presentation Transcript
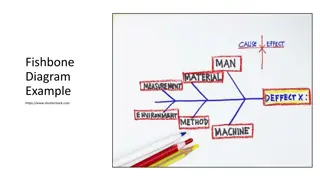
CAUSE AND EFFECT DIAGRAM
Also known as.. The Fishbone Diagram The Ishikawa Diagram The Fishykawa Diagram!
What is a fishbone/cause and effect diagram? What is a fishbone/cause and effect diagram? It s a graphic a picture a structured and systematic way of looking at an effect (the problem) and the causes, conditions or relationships that bring about, or could bring about, the effect
Its purpose is to: voice theories about the root cause see the relationships among them generate as many ideas as possible, concerning the conditions or causes related to the effect
Its purpose is to: highlight the main causes, minor causes and sub causes leading to the effect (the problem) And it s an important tool in the early stages of problem solving
Fishbone /cause and effect diagram Fishbone /cause and effect diagram Cause and effect diagrams are multi-leveled: Level one asks what are the causes of the effect? Level two asks what are the causes of the causes? Level three asks what causes these subsidiary causes?
Fishbone /cause and effect diagram Fishbone /cause and effect diagram Generating ideas is the same as the brainstorming process But what is different is that each main bone of the diagram is a category within which the brainstorming ideas are included
How to construct a fishbone diagram .. Begin by agreeing on or identifying a single problem (the effect) and placing it in the head or the effect box of the diagram Effect or the Problem
How to construct a fishbone diagram .. Draw the main bones on the skeleton and attach a major cause to each The causes could be material, machines, measurement, man, methods Or equipment, people, technology, environment, policies. You can even make up your own!
How to construct a fishbone diagram .. Brainstorm the sub causes and place them on the smaller bones
Whats next? Display the fishbone for others to see and comment on and contribute to Sit back and reflect on the fishbone diagram Interpretation how are we going to improve? Are there repeated or similar causes? Prioritise what must be done first are there patient/staff safety or risk factors that must be addressed? Are there dependencies amongst the causes? does one thing lead to another
Whats next? Once you have done this you can: prioritise and come to a consensus to further analyse a particular cause, using the PDSA tool, come up with ideas to problem solve or make changes to improve the situation
Lets do it! Let s do it!!!
CAUSE AND EFFECT CAUSE AND EFFECT Step 1 Decide on the problem (or the effect ) and write it in the head of the fish Step 2 Allocate the major causes of the problem to the skeleton of the fish (using pink and red post its) Step 3 Brainstorm the sub causes of each major cause and write them on the skeleton of the fish Step 4 Which sub cause would you use for your PDSA?