
Rainfall-Runoff Modelling Using Artificial Neural Network: A Case Study of Purna Sub-catchment, India
Rainfall-runoff modeling is crucial in understanding the relationship between rainfall and runoff. This study focuses on developing a rainfall-runoff model for the Upper Tapi basin in India using Artificial Neural Networks (ANNs). ANNs mimic the human brain's capabilities and have been widely used i
3 views • 26 slides

Runoff
Runoff is the surface flow of precipitation in drainage channels that can be utilized for engineering purposes. Catchment characteristics, including stream order, drainage density, length of stream, form factor, and circularity ratio, play a crucial role in determining how well a watershed is draine
7 views • 30 slides

Runoff in Hydrology
Runoff in hydrology refers to surface water flow from precipitation and other sources in drainage basins. It plays a crucial role in stream flow and peak flood formation, influenced by factors like overland flow, interflow, and groundwater flow. This article explores the sources of runoff, including
7 views • 27 slides

Human Impact on Water Systems in Agriculture
Human activities, such as animal farming, can significantly impact the Earth's surface and water systems by introducing excess nutrients and waste runoff. This leads to eutrophication, soil erosion, and water contamination. Farmers are working on conservation practices to mitigate these issues, such
7 views • 10 slides

Production Possibilities Curve and Economic Growth
The Production Possibilities Curve illustrates trade-offs in an economy producing two goods, showing possible combinations using available resources. Efficiency on the curve means no way to make some better off without others worse off. Opportunity cost is the given-up production when increasing one
5 views • 5 slides

Runoff in Surface Water Systems
Runoff, the flow of precipitation and other contributions in surface streams, plays a crucial role in watershed systems. It encompasses various sources such as surface runoff, interflow, and base flow. Surface runoff, which travels over the ground surface to channels, is influenced by factors like s
5 views • 27 slides

Monetary Policy Effectiveness in the IS-LM Framework
The relative effectiveness of monetary policy in influencing investment, employment, output, and income depends on the shape of the LM curve and the IS curve. A steeper LM curve signifies higher effectiveness as it indicates less interest elastic demand for money, resulting in significant changes in
2 views • 24 slides

The Normal Probability Curve
The Normal Probability Curve, also known as the normal distribution, is a fundamental concept in statistics. It is symmetric around the mean, with key characteristics such as equal numbers of cases above and below the mean, and the mean, median, and mode coinciding. The curve's height decreases grad
2 views • 10 slides

Strength-Duration Curve in Neuromuscular Stimulation
The strength-duration curve depicts the relationship between electrical stimulus intensity and time required for minimal muscle contraction. It helps assess nerve damage in lower motor neuron lesions. Various types of curves exist based on innervation status, such as normal innervation, complete den
3 views • 15 slides

Hyetograph, Runoff, and Hydrograph in Hydrology
A hyetograph represents rainfall intensity over time, crucial for predicting extreme floods. Runoff is the unevaporated portion of rainfall that flows into rivers or oceans, while hydrograph displays discharge variations over time in streams. Surface runoff, interflow, and base flow are key classifi
6 views • 15 slides

Managing Urban Stormwater Runoff: North Hennepin Community College MS4 Plan
North Hennepin Community College is designated as an MS4 due to its location in an urban area, aiming to treat urban stormwater runoff and improve water quality. The MS4 Plan includes implementing six minimum control measures, such as public education, illicit discharge detection, and construction s
1 views • 10 slides

The Phillips Curve and Its Implications
The Phillips Curve, introduced by economist A.W. Phillips in 1958, initially showed an inverse relationship between unemployment rate (u%) and inflation rate (tt%). This led policymakers to consider a trade-off between reducing unemployment and increasing inflation. However, the concept faced challe
3 views • 22 slides

Nonlinear Curve Fitting Techniques in Engineering
Utilizing nonlinear curve fitting techniques is crucial in engineering to analyze data relationships that are not linear. This involves transforming nonlinear equations into linear form for regression analysis, as demonstrated in examples and methods such as polynomial interpolation and exponential
0 views • 18 slides
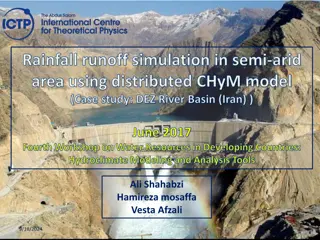
Rainfall-Runoff Simulation in Semi-Arid Area Using Distributed CHyM Model: DEZ River Basin Study
This case study delves into the simulation of rainfall-runoff using the CHyM model in the semi-arid area of the DEZ River Basin in Iran. The study focuses on water resources management, flood control, and forecasting of flood discharge parameters, emphasizing the importance of accurate modeling for
1 views • 22 slides
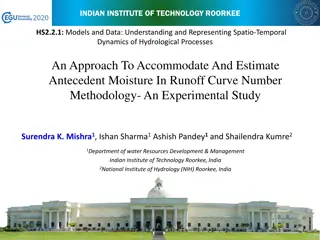
Spatio-Temporal Dynamics of Hydrological Processes at IIT Roorkee
This study conducted at the Indian Institute of Technology Roorkee focuses on modeling and understanding hydrological processes, particularly in estimating antecedent moisture in the Runoff Curve Number methodology. The research delves into the historical background of the Soil Conservation Service
1 views • 13 slides

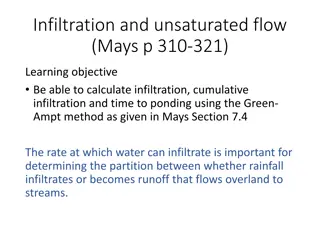
Infiltration and Unsaturated Flow in Hydrology
This content delves into the key concepts of infiltration and unsaturated flow in hydrology, focusing on calculating infiltration, cumulative infiltration, and time to ponding using the Green-Ampt method. It covers important topics such as runoff rate, infiltration capacity, cumulative infiltration,
3 views • 8 slides
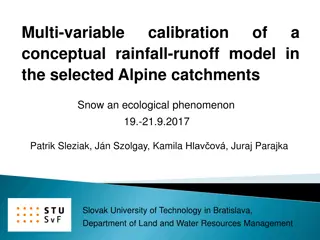
Calibration of Multi-Variable Rainfall-Runoff Model Using Snow Data in Alpine Catchments
Explore the calibration of a conceptual rainfall-runoff model in Alpine catchments, focusing on the importance of incorporating snow data. The study assesses the benefits of using multi-objective approaches and additional datasets for model performance. Various aspects such as snow cover, groundwate
1 views • 16 slides

Distribution Pattern of River Zones in China
China has a vast network of rivers with different characteristics and distribution patterns. The country is divided into five zones based on factors like precipitation and runoff levels, ranging from abundant to deficit zones. These zones play a crucial role in understanding the water resources and
1 views • 14 slides

Stormwater Management and Best Management Practices
Stormwater management is crucial for protecting our environment from pollutants in runoff water. Best Management Practices (BMPs) are a combination of structural, vegetative, and managerial techniques used to prevent water pollution and improve water quality. Learn about stormwater pollution, minimu
4 views • 15 slides
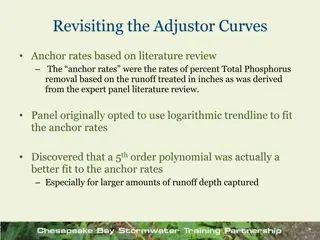
Revisiting Adjustor Curves for Total Phosphorus Removal Rates
Based on a literature review, it was found that a 5th-order polynomial curve is a better fit than the originally used logarithmic trendline for anchor rates of percent Total Phosphorus removal related to runoff depth. The expert panel report reflects the old curves while trendline equations in FAQ d
5 views • 7 slides

Practical Guide to Drawing Long-Term Yield Curve at Krugersdrift Dam
Learn how to draw a long-term yield curve at Krugersdrift Dam step-by-step, including setting up the study, browsing for data, importing hydrology files, manipulating the curve for accuracy, and achieving the final result.
1 views • 7 slides
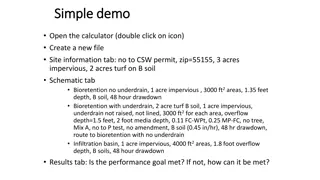
Stormwater Management Calculator Overview
Explore the functionalities of a stormwater management calculator that helps in analyzing stormwater runoff, pollutants, and BMP efficiencies. Learn about different BMP types, performance goals, and annual pollutant reduction targets to achieve effective stormwater management. Understand how the cal
1 views • 14 slides
Water Harvesting Techniques in Rainfed Agriculture & Watershed Management
Water harvesting plays a crucial role in rainfed agriculture by collecting and storing runoff water for irrigation in arid and semi-arid regions. Mr. Anil Swami, an assistant professor, discusses the importance of water harvesting techniques, including runoff farming and rainwater harvesting. He emp
0 views • 13 slides
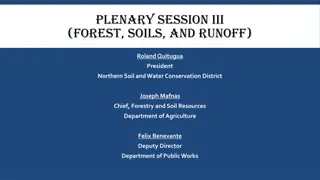
Plenary Session III on Forest, Soils, and Runoff Featuring Key Speakers
The Plenary Session III on Forest, Soils, and Runoff showcased insights from prominent figures such as Roland Quitugua, President of the Northern Soil and Water Conservation District, Joseph Mafnas, Chief of Forestry and Soil Resources at the Department of Agriculture, and Felix Benevante, Deputy Di
4 views • 4 slides

Exploring Watersheds and Runoff with Physical and Computational Models
Engage in hands-on activities using physical models like a big tarp to simulate rainfall on landscapes and explore the movement of water. Dive into discussions about the pros and cons of using physical models for studying water flow. Discover the introduction to computational models and discretizati
0 views • 38 slides

Production Possibilities Curve and Economic Growth
Explore the concept of the production possibilities curve, including its assumptions, implications of being under or beyond the curve, types of opportunity costs, shifts in the curve, and the impact of economic growth on a nation's productivity and output capacity.
1 views • 18 slides

Seasonal Forecasts of Runoff and River Discharge in South America
Study on skill and post-processing of seasonal forecasts of runoff and river discharge in South America using hindcasts and reference simulations. Evaluation method and results are discussed for assessing forecast skill.
4 views • 10 slides

MIDS Calculator - Stormwater Runoff Reduction Tool
The MIDS Calculator is an Excel-based tool that quantifies reductions in stormwater runoff volume, phosphorus (P), and total suspended solids (TSS) for specific Best Management Practices (BMPs). It helps select and size the best BMPs for a particular situation based on performance goals. Learn how t
0 views • 12 slides

Development of Sensitivity Analysis Application for HEC HMS Rainfall-Runoff Model
This content discusses the development of a sensitivity analysis application for an event-based HEC HMS rainfall-runoff model. It covers hydrological modeling, simulation options, Siron basin modeling, meteorological modeling, control specifications, and more.
1 views • 8 slides

Runoff and Surface Runoff in Hydrology
Surface runoff and runoff are fundamental concepts in hydrology, describing the flow of water in drainage basins and streams. Runoff represents the total water flow, while surface runoff specifically refers to water reaching streams without percolating. Understanding these terms is crucial for analy
5 views • 41 slides

Preliminary Design of Storm Sewer System using Rational Method
Engineers use the rational method to estimate storm runoff in absence of rainfall data when designing storm sewer systems. This method considers factors like time of concentration and peak runoff rates. The design involves calculating flow times, pipe sections, and selecting appropriate diameters fo
14 views • 13 slides

Hydrology in Design - Dr. Khayyun A. Rahi
This lecture covers various aspects of hydrology in design, focusing on IDF curves and runoff calculations for Austin. It provides insights into the rational method for determining design runoff rates based on storm frequency and intensity. Practical examples illustrate the application of volumetric
2 views • 16 slides
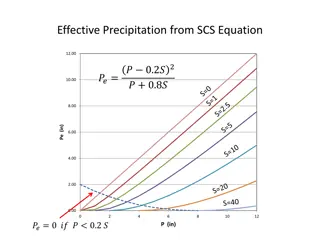
Hydrology Equations and Examples for Watershed Analysis
Explore effective precipitation calculations using the SCS equation, understand runoff estimation from the SCS Curve Number equation, and solve examples related to watershed characteristics, antecedent moisture conditions, and land use impacts on runoff. Learn about retention factors, soil groups, a
2 views • 7 slides
Calculation of Infiltration and Runoff using Green-Ampt Method
Learn how to calculate infiltration, cumulative infiltration, and time to ponding using the Green-Ampt method in hydrology. Understand the concepts of infiltration rate, runoff rate, and ponding time, illustrated through examples with silty clay soil. Explore the importance of determining water infi
3 views • 13 slides

Solving Stormwater Runoff Issues in Community Waters Science Unit
Explore the process of defining and solving stormwater runoff problems in the Community Waters Science Unit Lesson. Discover stakeholder perspectives, criteria for successful solutions, and more to address local environmental challenges effectively.
1 views • 11 slides
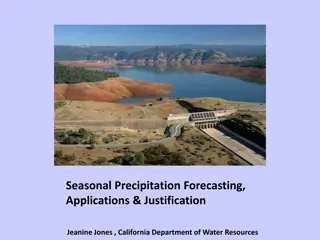
Seasonal Precipitation Forecasting Applications and Justification
Explore the significance of seasonal precipitation forecasting for water management decisions, as emphasized by the Western States Water Council. Discover the current limitations in predicting precipitation beyond short-term forecasts and the call for improved subseasonal to seasonal forecasting cap
0 views • 20 slides

Hyetograph, Runoff, and Hydrograph in Hydrological Analysis
Learn about the hyetograph as a graphical representation of rainfall intensity over time, runoff as the unevaporated portion of rainfall flowing to rivers, and hydrograph as a plot of discharge versus time for flood analysis. Explore the classification of runoff and the importance of unit hydrograph
2 views • 15 slides

Runoff Depth and Direct Hydrograph Calculation
Calculate runoff depth and direct hydrographs for a watershed with specific land use and soil groups, inputting rainfall data and watershed characteristics. Determine SCS unit hydrograph and rainfall excess hyetograph. Explore kinematic wave overland flow and distributed hydrologic modeling.
4 views • 4 slides

Guam Stormwater Spreadsheet Training: TR-55 Peak Runoff Calculation
This draft document prepared by Tyler Miller provides training on stormwater management using the TR-55 method for peak runoff calculation. It covers topics such as runoff curve numbers, determining hydrologic soil groups, land cover assessment, time of concentration calculation, and shallow flow an
3 views • 9 slides

Processes Involved in Runoff Generation and Unsaturated Soil Flow
Explore the processes involved in runoff generation, surface runoff occurrence, wetting front in sandy soil, continuity equation in unsaturated porous medium, and flow in unsaturated soil. Understand how surface runoff occurs when water input exceeds infiltration capacity, and how hydraulic conducti
0 views • 5 slides