Hyetograph, Runoff, and Hydrograph in Hydrology

 
HYETOGRAPH
 
CONTENTS
 
:
 
1.
Hyetograph
2.
Runoff
3.
Classification of
 
runoff
4.
Hydrograph
5.
Unit Hydrograph
 
Analysis
6.
Hydrograph
 
Vocabulary
 
HYETOGRAPH
A 
hyetograph is
 
a
 
graphical
 
representation
 
of
the relationship between the rainfall intensity
and time.
It is 
the plot 
of 
the rainfall intensity 
drawn on the
ordinate axis against 
time on the 
abscissa
 
axis.
The 
hyetograph is 
a 
bar
 
diagram.
The 
area under the hyetograph gives 
the 
total
rainfall occurred 
in 
that
 
period.
This
 
c
h
a
rt
 
i
s
 
v
e
ry
 
us
e
f
u
l
 
in
 
r
e
p
r
e
s
e
n
t
i
n
g
 
t
he
characteristics 
of 
storm, and 
is 
particularly
important 
in 
developing the design storm to
predict extreme
 
floods.
 
RUNOFF
Runoff 
is 
that 
portion 
of 
rainfall 
that is not
evaporated.
The 
runoff 
is 
defined 
as the 
portion of 
the 
rainfall
that makes 
its 
way towards 
river or ocean 
as
surface 
or 
subsurface
 
flow.
The 
discharge 
flowing in a 
river 
is 
the 
runoff
from the basin drained 
by that
 
river.
Runoff 
is usually expressed as volume per unit
time, the 
common 
unit being m3/s 
or
 
cumec.
 
When 
rainfall
 
starts,
 
some
 
gets caught in 
retention
storage depressions 
where it will be 
evaporated
again, but some 
enters 
the ground 
(infiltration,
including 
some 
from detention storage) 
where it will
contribute 
to the channel flow 
at 
some later
 
time
.
 
Classification of
 
Runoff
 
S
u
r
f
a
c
e
 
r
u
n
o
f
f
:
Water 
flows over the land and is first to reach the
streams and rivers which ultimately discharge the
water to 
the
 
sea.
I
n
t
e
r
 
f
l
o
w
 
o
r
 
s
u
b
s
u
r
f
a
c
e
 
f
l
o
w
:
A portion 
of 
rainfall infiltrates into surface soil and
depending 
upon 
the geology of basins, runs as
subsurface 
runoff 
and reaches the streams and
 
rivers.
G
r
o
u
n
d
 
w
a
t
e
r
 
f
l
o
w
 
o
r
 
b
a
s
e
 
f
l
o
w
:
It is that portion of rainfall which after infiltration,
percolates down and joins 
the 
ground water reservoir
which is ultimately connected to the
 
ocean.
 
HYDROGRAPH
 
A 
hydrograph 
is a 
graphical plot 
of 
discharge
 
of
a 
natural stream or river versus
 
time.
It shows variations 
of 
discharge with time, at 
a
particular point of 
a
 
stream.
It 
also shows the 
time 
distribution 
of 
total 
runoff
at the 
point of
 
measurement.
Discharge 
is 
plotted on 
Y-axis 
and the
corresponding 
time 
is plotted 
on
 
X-axis.
Flood 
analysis 
and 
derivation 
of unit 
hydrograph
a 
single peaked hydrograph 
is
 
required.
Hydrograph analysis 
is 
the most widely used
method 
of 
analyzing surface
 
runoff.
 
Hydrograph 
determines 
the 
peak flood
magnitude of flood 
for 
the 
design 
of hydraulic
structures i.e. 
a dam, 
spilway, 
bridge, 
culvert, etc.
Hydrographs are 
also described 
in terms of the
following time 
characteristics
 
:
1
)
T
i
m
e
 
t
o
 
P
e
a
k
,
 
t
p
:
Time 
from 
the beginning of the 
rising 
limb to the
occurrence 
of the peak
 
discharge.
The time to 
peak is 
largely determined by
drainage
 
characteristics such 
as 
drainage
density, 
slope, channel 
roughness, 
and 
soil
infiltration characteristics. 
Rainfall 
distribution 
in
space 
also 
affects 
the time to
 
peak.
 
2
.
)
T
i
m
e
 
o
f
 
C
o
n
c
e
n
t
r
a
t
i
o
n
,
 
t
c
:
Time 
required 
for water to travel from the
most 
hydraulically 
remote 
point in 
the 
basin to
the basin 
outlet. 
For 
rainfall events 
of 
very
long 
duration, 
the time 
of concentration 
is
associated 
with the time 
required 
for the
system to achieve the maximum or
equilibrium
 
discharge.
The drainage 
characteristics 
of length and 
slope,
together 
with 
the hydraulic characteristics 
of the
flow 
paths, 
determine the time 
of
 
concentration.
 
3
.
)
L
a
g
 
T
i
m
e
,
 
t
l
:
 
Time 
between the center of 
mass 
of the 
effective
rainfall hyetograph and the center of mass of the direct
runoff
 
hydrograph.
The basin lag is an important concept in linear
modeling of basin response. The lag time is a
parameter that appears often in theoretical and
conceptual models of basin 
behavior. However, 
it is
sometimes 
difficult 
to measure in 
real 
world situations.
Many empirical equations have been proposed in the
literature. The simplest of these equations computes
the basin lag as a power function of the basin
 
area.
 
4
.
)
T
i
m
e
 
B
a
s
e
,
 
t
b
:
Duration 
of the 
direct 
runoff
 
hydrograph.
 
UNIT HYDROGRAPH
 
ANALYSIS
 
S
h
e
r
m
a
n
 
(
1
9
3
2
)
 
f
i
r
s
t
 
p
r
o
p
o
s
e
d
 
t
h
e
 
u
n
i
t
h
y
d
r
o
g
r
a
p
h
 
c
o
n
c
e
p
t
.
 
T
h
e
 
U
n
i
t
 
H
y
d
r
o
g
r
a
p
h
 
(
U
H
)
 
o
f
 
a
w
a
t
e
r
s
h
e
d
 
i
s
 
d
e
f
i
n
e
d
 
a
s
 
t
h
e
 
d
i
r
e
c
t
 
r
u
n
o
f
f
h
y
d
r
o
g
r
a
p
h
 
r
e
s
u
l
t
i
n
g
 
f
r
o
m
 
a
 
u
n
i
t
 
v
o
l
u
m
e
 
o
f
 
e
x
c
e
s
s
r
a
i
n
f
a
l
l
 
o
f
 
c
o
n
s
t
a
n
t
 
i
n
t
e
n
s
i
t
y
 
a
n
d
 
u
n
i
f
o
r
m
l
y
d
i
s
t
r
i
b
u
t
e
d
 
o
v
e
r
 
t
h
e
 
d
r
a
i
n
a
g
e
 
a
r
e
a
.
 
T
h
e
 
d
u
r
a
t
i
o
n
 
o
f
t
h
e
 
u
n
i
t
 
v
o
l
u
m
e
 
o
f
 
e
x
c
e
s
s
 
o
r
 
e
f
f
e
c
t
i
v
e
 
r
a
i
n
f
a
l
l
,
s
o
m
e
t
i
m
e
s
 
r
e
f
e
r
r
e
d
 
t
o
 
a
s
 
t
h
e
 
e
f
f
e
c
t
i
v
e
 
d
u
r
a
t
i
o
n
,
d
e
f
i
n
e
s
 
a
n
d
 
l
a
b
e
l
s
 
t
h
e
 
p
a
r
t
i
c
u
l
a
r
 
u
n
i
t
h
y
d
r
o
g
r
a
p
h
.
 
T
h
e
 
u
n
i
t
 
v
o
l
u
m
e
 
i
s
 
u
s
u
a
l
l
y
 
c
o
n
s
i
d
e
r
e
d
t
o
 
b
e
 
a
s
s
o
c
i
a
t
e
d
 
w
i
t
h
 
1
 
c
m
 
(
1
 
i
n
c
h
)
 
o
f
 
e
f
f
e
c
t
i
v
e
r
a
i
n
f
a
l
l
 
d
i
s
t
r
i
b
u
t
e
d
 
u
n
i
f
o
r
m
l
y
 
o
v
e
r
 
t
h
e
 
b
a
s
i
n
 
a
r
e
a
.
 
HYDROGRAPH
 
VOCABULARY
 
Rising limb, a falling limb, and a recession.
 
The
rising limb and falling limb are separated by
 
the
hydrograph crest, and 
the limbs 
are separated
from 
the 
recession by inflection points. The
rising limb is typically steeper 
than the falling
limb.
 
T
h
e
 
r
i
s
i
n
g
 
l
i
m
b
 
:
-
T
h
e
 
r
i
s
i
n
g
 
l
i
m
b
 
i
s
 
t
h
e
 
a
s
c
e
n
d
i
n
g
 
p
o
r
t
i
o
n
 
o
f
 
t
h
e
h
y
d
r
o
g
r
a
p
h
 
c
o
r
r
e
s
p
o
n
d
i
n
g
 
t
o
 
t
h
e
 
i
n
c
r
e
a
s
e
 
o
f
 
d
i
s
c
h
a
r
g
e
d
u
e
 
t
o
 
g
r
a
d
u
a
l
 
a
c
c
u
m
u
l
a
t
i
o
n
 
o
f
 
s
t
o
r
a
g
e
 
i
n
 
t
h
e
 
c
h
a
n
n
e
l
s
e
x
i
s
t
i
n
g
 
i
n
 
t
h
e
 
a
r
e
a
 
a
n
d
 
a
l
s
o
 
o
v
e
r
 
t
h
e
 
w
a
t
e
r
s
h
e
d
s
u
r
f
a
c
e
.
 
T
h
e
 
r
i
s
i
n
g
 
l
i
m
b
 
i
s
 
a
l
s
o
 
k
n
o
w
n
 
a
s
 
t
h
e
c
o
n
c
e
n
t
r
a
t
i
o
n
 
c
u
r
v
e
.
 
T
h
e
 
p
e
a
k
 
o
r
 
c
r
e
s
t
 
:
-
The peak or crest segment includes the part of the
hydrograph from the inflection point on 
the rising 
limb
to an inflection point on 
the 
recession limb. 
The 
peak
segment 
is the most important part of the hydrograph
because 
it indicates the peak flow rate. 
The peak
represents the arrival of flow at the outlet 
from 
all parts
of the
 
basin.
 
T
h
e
 
r
e
c
e
s
s
i
o
n
 
l
i
m
b
 
:
-
After the 
inflection 
point, 
there is 
no inflow to
the stream due to surface 
runoff. 
The 
recession
limb extends from the inflection point, 
to the 
point
of 
recommencement 
of the 
natural base 
flow or
ground 
water 
flow. 
The 
recession 
limb
represents the withdrawl of water from the
storage already built up 
in the 
catchment
 
during
the earlier phase 
of the 
hydrograph 
when
surface 
runoff 
was
 
occuring
.
undefined
 
 
T
H
A
N
K
 
Y
O
U
Slide Note
Embed
Share

A hyetograph represents rainfall intensity over time, crucial for predicting extreme floods. Runoff is the unevaporated portion of rainfall that flows into rivers or oceans, while hydrograph displays discharge variations over time in streams. Surface runoff, interflow, and base flow are key classifications of runoff. Hydrograph analysis is vital for studying surface runoff and deriving unit hydrographs.

  • Hyetograph
  • Runoff
  • Hydrograph
  • Rainfall
  • Surface Water

Uploaded on Aug 14, 2024 | 0 Views


Download Presentation

Please find below an Image/Link to download the presentation.

The content on the website is provided AS IS for your information and personal use only. It may not be sold, licensed, or shared on other websites without obtaining consent from the author. Download presentation by click this link. If you encounter any issues during the download, it is possible that the publisher has removed the file from their server.

E N D

Presentation Transcript


  1. HYETOGRAPH

  2. CONTENTS : 1. Hyetograph 2. Runoff 3. Classification of runoff 4. Hydrograph 5. Unit HydrographAnalysis 6. Hydrograph Vocabulary

  3. HYETOGRAPH A hyetograph is a graphical representation of the relationship between the rainfall intensity and time. It is the plot of the rainfall intensity drawn on the ordinate axis against time on the abscissa axis. The hyetograph is a bar diagram. The area under the hyetograph gives the total rainfall occurred in that period. This chart is very useful in representing the characteristics of storm, and is particularly important in developing the design storm to predict extreme floods.

  4. RUNOFF Runoff is that portion of rainfall that is not evaporated. The runoff is defined as the portion of the rainfall that makes its way towards river or ocean as surface or subsurface flow. The discharge flowing in a river is the runoff from the basin drained by that river. Runoff is usually expressed as volume per unit time, the common unit being m3/s or cumec.

  5. When rainfall starts, some gets caught in retention storage depressions where it will be evaporated again, but some enters the ground (infiltration, including some from detention storage) where it will contribute to the channel flow at some later time.

  6. Classification of Runoff Surface runoff: Water flows over the land and is first to reach the streams and rivers which ultimately discharge the water to the sea. Inter flow or subsurface flow: A portion of rainfall infiltrates into surface soil and depending upon the geology of basins, runs as subsurface runoff and reaches the streams and rivers. Ground water flow or base flow: It is that portion of rainfall which after infiltration, percolates down and joins the ground water reservoir which is ultimately connected to the ocean.

  7. HYDROGRAPH A hydrograph is a graphical plot of discharge of a natural stream or river versus time. It shows variations of discharge with time, at a particular point of a stream. It also shows the time distribution of total runoff at the point of measurement. Discharge is plotted on Y-axis and the corresponding time is plotted on X-axis. Flood analysis and derivation of unit hydrograph a single peaked hydrograph is required. Hydrograph analysis is the most widely used method of analyzing surface runoff.

  8. Hydrograph determines the peak flood magnitude of flood for the design of hydraulic structures i.e. a dam, spilway, bridge, culvert, etc. Hydrographs are also described in terms of the following time characteristics : 1) Time to Peak, tp: Time from the beginning of the rising limb to the occurrence of the peak discharge. The time to peak is largely determined by drainage characteristics such as drainage density, slope, channel roughness, and soil infiltration characteristics. Rainfall distribution in space also affects the time to peak.

  9. 2.) Time of Concentration, tc: Time required for water to travel from the most hydraulically remote point in the basin to the basin outlet. For rainfall events of very long duration, the time of concentration is associated with the time required for the system to achieve the maximum or equilibrium discharge. The drainage characteristics of length and slope, together with the hydraulic characteristics of the flow paths, determine the time of concentration.

  10. 3.) Lag Time, tl: Time between the center of mass of the effective rainfall hyetograph and the center of mass of the direct runoff hydrograph. The basin lag is an important concept in linear modeling of basin response. The lag time is a parameter that appears often in theoretical and conceptual models of basin behavior. However, it is sometimes difficult to measure in real world situations. Many empirical equations have been proposed in the literature. The simplest of these equations computes the basin lag as a power function of the basin area. 4.) Time Base, tb: Duration of the direct runoff hydrograph.

  11. UNIT HYDROGRAPH ANALYSIS Sherman (1932) first proposed the unit hydrograph concept. The Unit Hydrograph (UH) of a watershed is defined as the direct runoff hydrograph resulting from a unit volume of excess rainfall of constant intensity and uniformly distributed over the drainage area. The duration of the unit volume of excess or effective rainfall, sometimes referred to as the effective duration, defines and labels the particular unit hydrograph. The unit volume is usually considered to be associated with 1 cm (1 inch) of effective rainfall distributed uniformly over the basin area.

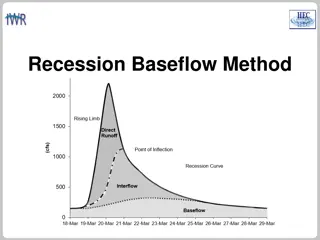
  12. HYDROGRAPHVOCABULARY Rising limb, a falling limb, and a recession. The rising limb and falling limb are separated by the hydrograph crest, and the limbs are separated from the recession by inflection points. The rising limb is typically steeper than the falling limb.

  13. The rising limb :- The rising limb is the ascending portion of the hydrograph corresponding to the increase of discharge due to gradual accumulation of storage in the channels existing in the area and also over the watershed surface. The rising limb is also known as the concentration curve. The peak or crest :- The peak or crest segment includes the part of the hydrograph from the inflection point on the rising limb to an inflection point on the recession limb. The peak segment is the most important part of the hydrograph because it indicates the peak flow rate. The peak represents the arrival of flow at the outlet from all parts of the basin.

  14. The recession limb :- After the inflection point, there is no inflow to the stream due to surface runoff. The recession limb extends from the inflection point, to the point of recommencement of the natural base flow or ground water flow. The recession limb represents the withdrawl of water from the storage already built up in the catchment during the earlier phase of the hydrograph when surface runoff was occuring.

  15. THANK YOU

More Related Content

giItT1WQy@!-/#giItT1WQy@!-/#giItT1WQy@!-/#giItT1WQy@!-/#giItT1WQy@!-/#giItT1WQy@!-/#giItT1WQy@!-/#giItT1WQy@!-/#giItT1WQy@!-/#giItT1WQy@!-/#