Hydrology Equations and Examples for Watershed Analysis
Explore effective precipitation calculations using the SCS equation, understand runoff estimation from the SCS Curve Number equation, and solve examples related to watershed characteristics, antecedent moisture conditions, and land use impacts on runoff. Learn about retention factors, soil groups, and direct runoff calculations for different scenarios.

Download Presentation

Please find below an Image/Link to download the presentation.
The content on the website is provided AS IS for your information and personal use only. It may not be sold, licensed, or shared on other websites without obtaining consent from the author. If you encounter any issues during the download, it is possible that the publisher has removed the file from their server.
You are allowed to download the files provided on this website for personal or commercial use, subject to the condition that they are used lawfully. All files are the property of their respective owners.
The content on the website is provided AS IS for your information and personal use only. It may not be sold, licensed, or shared on other websites without obtaining consent from the author.
E N D
Presentation Transcript
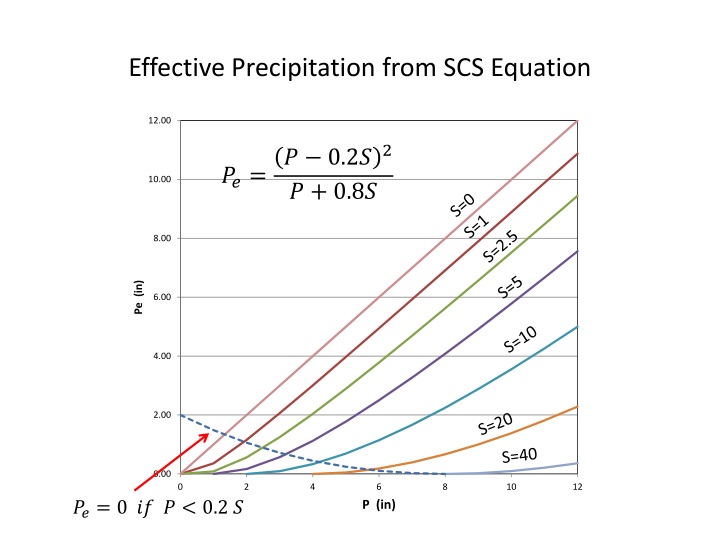
Effective Precipitation from SCS Equation 12.00 ? 0.2?2 ? + 0.8? ??= 10.00 8.00 Pe (in) 6.00 4.00 2.00 0.00 0 2 4 6 8 10 12 ??= 0 ?? ? < 0.2 ? P (in)
Solution of the SCS Curve Number Equation From Mays, 2011, Ground and Surface Water Hydrology
Example A watershed with CN = 60 experiences 4 in of precipitation. What is the direct runoff?
Retention and CN depends on Antecedent Moisture Condition (AMC) Tabulated values are for Average Moisture Conditions From Mays, 2011, Ground and Surface Water Hydrology
Retention and CN depends on Soil Group and Land Use .... .... From Mays, 2011, Ground and Surface Water Hydrology
Example A watershed has 40% residential (1/4 ac lots), 25% open space (good condition), 20% commercial and business (85% impervious) and 15% industrial (72% impervious) with corresponding soil groups of C, D, C and D. What is the depth of runoff from 6 in of rain Assume the rainfall occurs in a pattern of 2 in in first hour, 3 in in second hour and 1 in in third hour determine the rainfall excess hyetograph


