Advancing Radar Science: Open-Source Collaboration for Precipitation Estimation
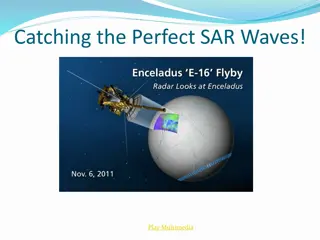
Explore the innovative work presented at the Open Radar Science in SAIL conference featuring collaborative research, open-source tools like Py-ART and Xradar, and value-added products enhancing quantitative precipitation estimates. Learn about CMAC, SQUIRE, and other techniques for radar data proces
2 views • 10 slides
Insights into Raindrop Size Distribution and Precipitation Intensity through Radar Technology
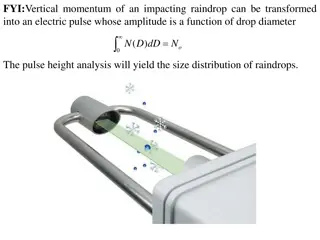
Vertical momentum of impacting raindrops can be converted into an electric pulse to analyze raindrop size distribution. Disdrometers using video cameras can directly count raindrops for sizing. Radar technology provides superior data on precipitation accumulation and intensity by measuring radar ref
4 views • 9 slides
BTH/OTH Radar and Maritime Surveillance Radar Overview
The article discusses BTH/OTH radar systems and maritime surveillance radars, exploring their functionalities, benefits, drawbacks, and real-world examples. It delves into the working principles of OTH radar, showcasing how it operates through the ionosphere. Additionally, it covers the concept of m
5 views • 12 slides
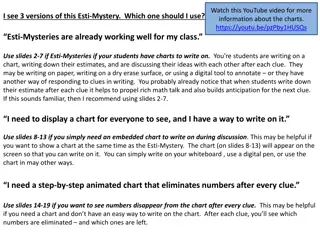
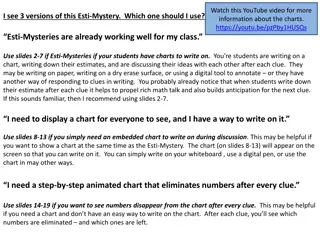
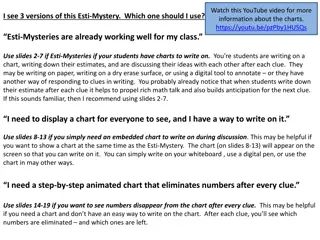
Exciting Ways to Use Esti-Mysteries with Embedded Charts
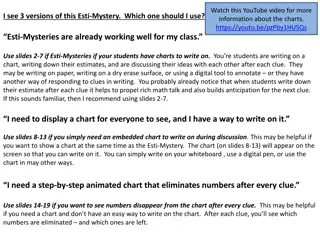
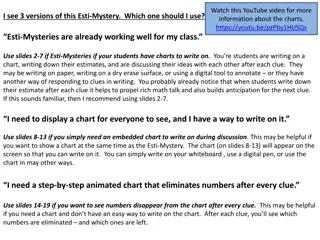
Explore three versions of Esti-Mysteries to engage students in writing estimates, discussing ideas, and using charts dynamically. Choose the version that best suits your classroom needs and enhance math discussions and anticipation for the next clue. Utilize slides with charts for writing, embedded
8 views • 19 slides
Drone Detection Using mmWave Radar for Effective Surveillance
Utilizing mmWave radar technology for drone detection offers solutions to concerns such as surveillance, drug smuggling, hostile intent, and invasion of privacy. The compact and cost-effective mmWave radar systems enable efficient detection and classification of drones, including those with minimal
0 views • 8 slides
Automotive Sensing Systems & Radar Technology Overview
Explore the world of automotive sensing systems and radar technology including radar speed guns. Learn about the sensors used in cars for various applications such as radar cruise control, collision detection, and more. Discover the characteristics of these sensors and how they can be augmented or r
0 views • 7 slides
Pie Chart Construction and Interpretation Tips
Learn how to draw pie charts, understand important data vocabulary, and analyze pie chart results with practical examples. Explore ways to present and measure data effectively using pie charts. Discover online resources for drawing pie charts even without a compass or protractor. Gain insights into
1 views • 10 slides
National 5 Applications of Maths: Charts, Graphs, and Tables Examples
Explore various examples related to reading bar charts, line graphs, stem-and-leaf diagrams, pie charts, and constructing stem-and-leaf charts in the context of National 5 Applications of Maths. Practice interpreting data from tables, line graphs, and stem-and-leaf diagrams to enhance your understan
1 views • 18 slides
Mastering Financial Presentation with Charts
Learn how to effectively present financial results and analysis like a pro using various types of charts such as waterfall charts, stacked bar charts, and mekko charts. Understand how to interpret income statements, identify areas for improvement, compare trends over time, and showcase budget growth
1 views • 21 slides
Mode-S Radar Operations and Identifiers
This simplified explanation delves into the fundamental principles of radar operations, focusing on Primary and Secondary radar systems, including Mode A/C and Mode S functionalities. It covers radar interrogation, replies, and the significance of radar identifiers (II and SI codes) in managing over
0 views • 19 slides
Recent Advances in Computational Doppler Radar Data Modeling
Explore the latest developments in computational modeling of Doppler radar data, focusing on error estimation, dual vs. single pol radars comparison, uncertainty quantification, and methodology for analyzing Doppler radar predictions against gauge measurements. The study involves data from multiple
0 views • 40 slides
Interactive Esti-Mystery Charts for Engaging Math Discussions
Explore three versions of Esti-Mystery charts to engage students in rich math discussions. Choose the slides based on your class's needs: for writing on charts, embedded charts for discussion, or an animated chart that eliminates numbers. Follow the clues, make estimates, and narrow down possibiliti
0 views • 19 slides
Interactive Esti-Mystery Charts for Engaging Math Lessons
Explore different versions of Esti-Mystery charts to engage students in rich math discussions. Choose from slides for writing on charts, embedded charts for discussion, or animated charts that eliminate numbers. Follow clues to estimate the number of beads in a glass and narrow down possibilities. E
0 views • 19 slides
Radar and Lidar Course Legal Requirements in Arkansas
This content provides information on the legal considerations, training requirements, and regulations for radar and lidar operators in Arkansas, as well as the criteria for CLEST certification. It covers statutes related to operator qualifications, speed trap laws, and the issuance of operator certi
1 views • 187 slides
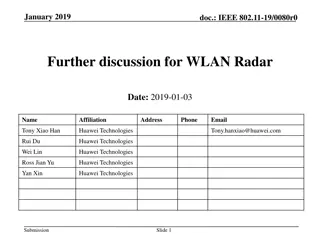
Radar Function Integration in WLAN: January 2019 Discussion
The January 2019 document IEEE 802.11-19/0080r0 explores integrating radar functions into WLAN to enhance coexistence. The proposal outlines various options, including modified schemes and dedicated indication methods for radar operation within WLAN frameworks. It emphasizes the need for feedback on
3 views • 12 slides
Weighted Moving Average Charts for Process Monitoring
Weighted moving average charts are powerful tools for detecting small shifts and trends in process means. By utilizing Uniformly Weighted Moving Average (UWMA) charts and Exponentially Weighted Moving Average (EWMA) charts, organizations can monitor and identify changes in process means with precisi
1 views • 29 slides
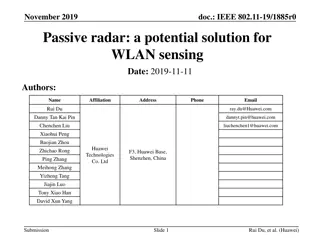
Passive Radar for WLAN Sensing in Indoor Scenarios
Radar and CSI have been proposed as potential WLAN sensing techniques. This document focuses on passive radar at 5 GHz in indoor scenarios, discussing background, experimental results, signal processing techniques, and potential impacts on WLAN standards.
6 views • 15 slides
WLAN-Based Radars in the 60GHz Band Using IEEE 802.11-19/1854r0 Protocol
Utilizing IEEE 802.11ad/11ay devices, this presentation demonstrates how radar applications can be implemented with minimal hardware modifications, showcasing enhanced radar information accuracy through device collaboration. The advantages of the 60GHz band for short-range radar applications, such a
0 views • 14 slides
Overview of Attribute Control Charts in Quality Management
Attribute control charts are used in quality management to monitor the conformity of products or services based on specific characteristics. Unlike variable charts, attribute charts categorize items as conforming or non-conforming. This summary discusses the importance of attribute charts, focusing
1 views • 71 slides
Complete Guide to Radar Charts: Benefits, Drawbacks, and Tips
Radar charts, also known as spider charts, offer a graphical way to compare data in a web-like form, making it easy to evaluate multiple alternatives based on various criteria. While radar charts have benefits like highlighting strengths and deficiencies clearly, they also come with drawbacks such a
1 views • 12 slides
Charts for Data Visualization in Excel 2016
Charts in Excel 2016 are powerful tools for visually representing quantitative data, helping to convey patterns, trends, and comparisons effectively. This guide covers the purpose of charts, avoiding chart junk, different types of charts like Column, Bar, Line, and more, and their specific uses in d
0 views • 17 slides
OLYMPEX Airborne Data Analysis for Snowfall Rate-Reflectivity Relationships
Utilizing Citation aircraft data from OLYMPEX, this study focuses on developing relationships between snowfall (rainfall) rate and radar reflectivity across various radar bands. Comparisons are made between in-situ aircraft data and retrieval products from CloudSat, GPM, and TRMM datasets. Results i
0 views • 12 slides
Data Presentation Techniques for Effective Communication
Explore various data presentation methods including charts, tables, and graphs to effectively communicate data insights. Learn about different types of charts, their uses, and guidelines for creating impactful visual representations. Dive into examples of bar charts, pareto charts, and pie charts to
5 views • 34 slides
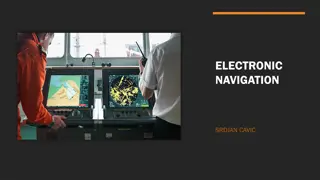
Electronic Navigation Technologies
Electronic navigation technologies, such as satellite navigation, radio navigation, and radar navigation, utilize electricity-powered systems for precise positioning and tracking. Satellite navigation systems rely on signals from satellites for autonomous geo-spatial positioning, while radio navigat
0 views • 9 slides
Interactive Esti-Mystery Charts for Engaging Math Discussions
Dive into the world of Esti-Mystery charts to enhance math discussions in your classroom. Choose the right version based on your needs, whether it's writing on a chart, using embedded charts, or animated charts. Follow the clues, make estimations, and encourage strong mathematical reasoning. Empower
0 views • 19 slides
Infant Growth Charts in MTN-016 for Effective Monitoring
Infant growth charts are essential tools used to monitor a child's growth trajectory over time. MTN-016 utilizes WHO growth standards for infants up to one year. Learn how to accurately use growth charts, adjust for gestational age, interpret percentile curves, and describe plotted points. These cha
0 views • 27 slides
Radar and Optical Observing Biases in Meteor Detection
Exploring radar and optical observing biases in meteor detection, this content delves into factors affecting mass detection, ionization efficiency, transverse radar effects, and more. Gain insights into how radar technology plays a crucial role in determining meteor properties and overcoming observa
1 views • 13 slides
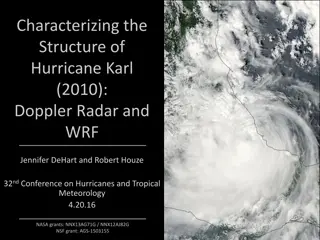
Analyzing Hurricane Karl (2010): Doppler Radar Insights
Detailed analysis of Hurricane Karl (2010) using Doppler radar and WRF simulations, focusing on precipitation patterns over Mexican terrain and underlying processes. Includes NASA and NOAA grants, airborne radar measurements, WRF simulations, flight tracks, and velocity distributions comparison betw
0 views • 19 slides
Interactive Esti-Mystery Charts for Rich Math Talk
Explore different versions of Esti-Mysteries to enhance math discussions in your class. Choose the version that best suits your needs, whether it's writing on charts, using embedded charts, or animated charts that eliminate numbers after each clue. Engage students in estimating bead counts and narro
0 views • 19 slides
Exponentially Weighted Moving Average Control Charts
Exponentially Weighted Moving Average (EWMA) control charts offer an effective alternative to Shewhart control charts for detecting small shifts in processes. This article explores the definition, properties, and calculations involved in EWMA control charts, providing insights on using this method i
0 views • 28 slides
Continuous Wave Radar Systems Overview
This presentation discusses Continuous Wave radar systems, including types of radar such as CW and FM-CW systems, as well as advantages and disadvantages of CW radar. It covers topics like CW radar operation, receiver technologies, and the Doppler effect in CW radar. The content provides a comprehen
0 views • 10 slides
Radar Familiarization Guide for Surface Operations: Understanding How Radar Works
This radar familiarization guide by the National Response Directorate provides important information on the proper use of radar equipment, including its basic principles, functions, and practical applications for surface operations. It emphasizes the significance of radar in ensuring safe navigation
0 views • 47 slides
Engaging Esti-Mystery Math Activity: Interactive Charts and Clues
Dive into the world of Esti-Mystery with this engaging math activity using interactive charts and clues. Choose the version that best suits your classroom - whether it's writing on charts, discussing ideas, or using animated charts. Follow the clues, eliminate numbers, and make estimations to uncove
0 views • 19 slides
Different Types of Bar Charts with Examples
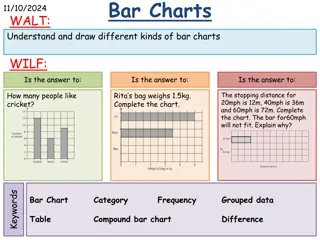
Explore the world of bar charts through various examples such as favorite subjects, animals, and sports, along with practical exercises. Learn to interpret and draw different types of bar charts like compound, comparative, and composite charts. Discover how to represent data visually and analyze key
0 views • 9 slides
Electromagnetic Waves and Radar Systems
Dive into the world of electromagnetic waves and radar systems with detailed explanations on wave basics, the electromagnetic spectrum, radar technology, and applications in geometry. Discover how radio waves are used in radar systems and the importance of electromagnetic energy in modern engineerin
0 views • 13 slides
Control Charts: Tools for Process Monitoring
Control charts are essential tools in statistical process control systems. They help distinguish between natural and assignable variations in a process. By monitoring sample statistics and setting control limits, organizations can detect issues and take corrective actions promptly. This comprehensiv
2 views • 24 slides
Interactive Esti-Mystery Charts for Classroom Engagement
Explore three versions of the Esti-Mystery activity to engage students in chart estimation and math discussions. Choose from options with writable charts, embedded charts, or animated charts to enhance the interactive learning experience. Follow clues, narrow down possibilities, make estimations, an
0 views • 19 slides
Human Activity Recognition from Millimeter-Wave Radar Point Clouds
Accurate human activity recognition (HAR) is crucial for context-aware applications. This study presents a framework utilizing mmWave radar-generated point clouds for HAR, addressing challenges related to privacy and sensors. Different machine learning approaches were evaluated, and a new open-sourc
0 views • 11 slides
Tracking and Identifying People with Millimeter Wave Radar
This study presents a human tracking and identification system using mmWave radar technology, offering high precision and the ability to conceal behind materials. The system achieved a median tracking accuracy of 0.16m and an identification accuracy of 89% for 12 individuals. Unlike traditional meth
0 views • 12 slides
Assessment and Quantification of HF Radar Uncertainty
This project focuses on assessing and quantifying uncertainty in High Frequency (HF) radar measurements, with key areas including sensitivity analysis and data record discussions. The team, comprised of experts from IBM, Rutgers, and ODU, aims to provide real-time ocean circulation forecasts for mar
0 views • 22 slides

