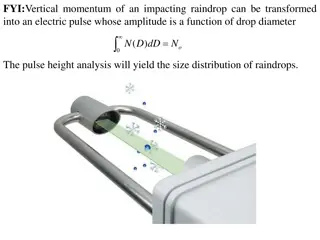
Assessment and Quantification of HF Radar Uncertainty
This project focuses on assessing and quantifying uncertainty in High Frequency (HF) radar measurements, with key areas including sensitivity analysis and data record discussions. The team, comprised of experts from IBM, Rutgers, and ODU, aims to provide real-time ocean circulation forecasts for marine businesses by improving radar measurement accuracy. The study covers the benefits of HF radar, surface current mapping capabilities, and analysis of radar data collected from the Mid-Atlantic region.

Download Presentation

Please find below an Image/Link to download the presentation.
The content on the website is provided AS IS for your information and personal use only. It may not be sold, licensed, or shared on other websites without obtaining consent from the author.If you encounter any issues during the download, it is possible that the publisher has removed the file from their server.
You are allowed to download the files provided on this website for personal or commercial use, subject to the condition that they are used lawfully. All files are the property of their respective owners.
The content on the website is provided AS IS for your information and personal use only. It may not be sold, licensed, or shared on other websites without obtaining consent from the author.
E N D
Presentation Transcript
Assessment and Quantification of HF Radar Uncertainty Fearghal O Donncha Sean McKenna Emanuele Ragnoli Teresa Updyke Hugh Roarty
Outline Introduction to team members Introduction to High Frequency Radar Discussion of the Study Area and Data Record Explanation of Principal Component Analysis Sensitivity Analysis of the Number of Modes and Window Length Conclusions 08/09/14
IBM/Rutgers/ODU IBM Deep Current: High resolution, real-time ocean circulation forecasts to support critical operations for marine based businesses Transportable algorithm for establishing uncertainty in real-time measuring system prior to assimilation into circulation model Rutgers and ODU are leading operators of HF radar in the Mid Atlantic and looking for applications of their measurements
INTRODUCTION TO HIGH FREQUENCY RADAR
25 MHz Transmit and Receive Antenna 4 meters
Surface Current Mapping Capability 25 MHz Radar : 12 m Ocean 6 m Range: 30 km Resolution: 1 km 13 MHz Radar : 23 m Ocean 12 m Range: 80 km Resolution: 3 km 05 MHz Radar : 60m Ocean 30 m Range: 180 km Resolution: 6 km
Baseline Comparison Direct comparison velocity measured by individual radar station Assess system performance without additional sensor requirements Localize data uncertainty and preliminary anomaly identification
Tools for Geophysical Data Analysis Normal Mode Analysis (NMA) Open Bounday Modal Analysis (OMA) Empirical Orthogonal Functions (EOF) Principal Components Analysis (PCA) Lagrangian Coherent Structures (LCS)
What does PCA do? Finds spatial patterns of variability and their time variation A common use is to reconstruct a cleaner data set by truncating at some number of modes
Graphical Representation 54% Variance explained 13% Variance explained PC1 PC2 Spatial consistency of PC1 implies tidal forcing Higher frequency influences evident in PCs
Temporal Categorization Evolution in time of PC1 & PC2 Increased dynamicity captured at days 182 - 184
ADCP Comparisons Reconstructed PC1 flows plotted against ADCP harmonic component
Number of Modes to Include 1. Fraction of Variance 70% - 2 modes 90% - 12 modes 95% - 29 modes 2. Residual Percent Variance 7 modes 3. Guttman-Kaiser criterion 20 modes 4. North s rule of thumb 9 modes
Temporal Window Width RMSE PC1 reconstruction and ADCP harmonic component Window width influences how well model captures shorter- term fluctuations
Number of PCA modes and Window Length General Circulation HIGH Window Length Fine Scale model, Sea Breeze Events LOW HIGH LOW # of PCA Modes
Conclusion A year of HF radar was analyzed using Principal Component Analysis The number of modes to retain and length of temporal window were tested We envision this as a preconditioning method for assimilation of HF radar data into a numerical model