Unveiling Chat-GPT: Myth vs. Reality in Artificial Intelligence
Delve into the world of Chat-GPT as it poses the essential question of aligning with, against, or remaining neutral towards artificial intelligence. Explore how Chat-GPT revolutionizes scientific writing, its drawbacks, risks, and ways to maximize its utility in various tasks.
0 views • 16 slides
Data Visualization with Matplotlib in Python
Matplotlib is a powerful Python package for data visualization, offering both an integrated interface (pyplot) and a native object-oriented interface. This tool enables users to create various types of plots and gives control over the visualization process. Learn about basic operations, differences
7 views • 19 slides
Impact of Rocket Chat at UB Hildesheim
Dive into the introduction and reception of Rocket Chat at UB Hildesheim during the Austrian Library Congress, focusing on its potential benefits for communication and collaboration among students and staff members. The study includes a survey, personal interviews, and analysis of the perceived secu
1 views • 20 slides
Chat Based data Engineering Tool Leading the Way with Ask On Data
To stay ahead of the curve in the fast-paced field of data engineering, creativity is essential. Chat-based solutions are becoming a major player in the development of data engineering as businesses look to streamline their data workflows. Chat based data engineering is transforming how teams intera
4 views • 1 slides
The Benefits of Ask On Data's Chat Based Data Pipeline Tool
Ask On Data represents a game-changing solution for businesses looking to harness the full potential of their data. By combining the convenience of chat based interactions with the power of advanced analytics, Ask On Data empowers users to unlock valuable insights and drive informed decision-making.
11 views • 2 slides
Revolutionizing with NLP Based Data Pipeline Tool
The integration of NLP into data pipelines represents a paradigm shift in data engineering, offering companies a powerful tool to reinvent their data workflows and unlock the full potential of their data. By automating data processing tasks, handling diverse data sources, and fostering a data-driven
10 views • 2 slides
Revolutionizing with NLP Based Data Pipeline Tool
The integration of NLP into data pipelines represents a paradigm shift in data engineering, offering companies a powerful tool to reinvent their data workflows and unlock the full potential of their data. By automating data processing tasks, handling diverse data sources, and fostering a data-driven
7 views • 2 slides
Bridging the Gap Between Teams and Data with Chat Based Data Engineering
There are a number of drawbacks to traditional data engineering methods, such as the requirement for specialized technical knowledge, disjointed tools, and intricate workflows.Enter Ask On Data, a revolutionary chat based data engineering tool that transforms the way companies handle their data, bri
5 views • 2 slides
Revolutionizing Workflows with Chat Based Data Engineering
Chat based interfaces like Ask On Data are reshaping the landscape of data engineering by prioritizing accessibility, collaboration, and efficiency. By leveraging the familiar format of messaging platforms, these tools bridge the gap between users and data systems, empowering individuals across the
7 views • 2 slides
Ask On Data A Chat Based Data Engineering Tool
In the field of data engineering, accuracy and efficiency are critical. Conventional methods frequently include laborious procedures and intricate interfaces. However, with the rise of chat based data engineering tool such as Ask On Data, a new era of data engineering is beginning. These cutting-edg
2 views • 2 slides
Open Source Chat Based Data Visualization With Helical Insight
Open Source Chat Based Data Visualization plays a pivotal role in modern business operations, enabling organizations to derive insights, make informed decisions, and drive growth. However, traditional visualization tools often come with high costs and steep learning curves, limiting accessibility an
1 views • 2 slides
Open Source Chat Based Reporting Tool on Decision-Making Processes
In today's data-driven business landscape, making informed decisions quickly is paramount for success. Traditional reporting methods often involve complex interfaces and time-consuming processes, hindering the agility required in fast-paced environments. However, the emergence of open source chat ba
1 views • 2 slides
Implementing Open Source Chat Based BI in Organizations with Helical Insight
In today's data-driven business landscape, implementing effective business intelligence (BI) solutions is crucial for organizations to stay competitive and make informed decisions. However, traditional BI tools often come with significant costs and complexities, making them inaccessible to many busi
2 views • 2 slides
Empowering Enterprises with Open Source Chat Based Reporting tool
In the dynamic landscape of corporate decision-making, the ability to swiftly access and analyze data is paramount. Traditional reporting methods often present challenges in terms of complexity, accessibility, and timeliness. However, with the emergence of open source chat based reporting platforms
0 views • 2 slides
Benefits of Open Source Chat-based Data Visualization
In the realm of Business Intelligence (BI), data visualization plays a pivotal role in transforming raw data into actionable insights. Traditional BI tools often require users to possess technical expertise in querying databases and creating visualizations. However, the emergence of open source chat
1 views • 2 slides
Open Source Alternative to Tableau for Data Visualization in 2024
As businesses increasingly rely on data-driven decisions, the demand for powerful data visualization tools continues to grow. Tableau has long been a leader in this space, known for its robust capabilities and user-friendly interface. However, open-source alternatives are gaining traction due to the
0 views • 2 slides
Reusing Phylogenetic Data for Enhanced Visualization and Analysis
Reusing phylogenetic data can revolutionize scientific research by enabling synthesis of knowledge and comparative analyses across scientific disciplines. However, a significant portion of valuable phylogenetic data is lost due to the prevalent use of static images for tree publication. To address t
0 views • 8 slides
SDMX Converter: A Tool for Data Transformation
SDMX Converter is a versatile tool developed by Eurostat that enables the conversion of data between various formats and SDMX. It supports formats like CSV, Excel, and DSPL, making it easy to transform non-SDMX data into the SDMX format. The tool comes in different applications like desktop, command
2 views • 19 slides
Interactive Plotting with ggplot and Shiny: Enhancing Galaxy Visualization Tools
Explore the concept of transforming existing ggplot2 Galaxy tools into interactive platforms using Shiny or Plotly implementations. Discover a variety of plot types available with ggplot2, such as barplots, violin plots, PCA plots, and heatmaps. Utilize additional plot options through various geom_*
3 views • 9 slides
EEG Conformer: Convolutional Transformer for EEG Decoding and Visualization
This study introduces the EEG Conformer, a Convolutional Transformer model designed for EEG decoding and visualization. The research presents a cutting-edge approach in neural systems and rehabilitation engineering, offering advancements in EEG analysis techniques. By combining convolutional neural
1 views • 6 slides
Design and Evaluation in Visualization Techniques
Understanding the importance of formal evaluations in visualization techniques, this material covers a range of evaluation methods including empirical and analytic approaches such as usability tests, controlled experiments, and expert reviews. It delves into the scientific method of hypothesis forma
1 views • 41 slides
Multidimensional Icons in Data Visualization Solutions
This collection showcases various types of visual icons used in data visualization to represent values of different variables, such as categorical, quantitative, and Boolean data. Each icon summarizes specific information for a given item in a collection, ranging from nominal and ordinal data to the
0 views • 9 slides
Enhancing Safety in Navigation Through Improved Data Quality Visualization
The IHO Data Quality Working Group focuses on classifying and depicting the quality of digital hydrographic information to ensure safe navigation. The group addresses the need for clear warnings on ECDIS displays regarding poor-quality survey data. Despite progress in developing visualization method
1 views • 34 slides
Software Design Patterns for Information Visualization
Explore design patterns for information visualization interfaces, understand the complexities, and leverage tools like Google API. Learn about different software design patterns, categories of patterns for information visualization, and the relationships between them. Discover the reference model fo
0 views • 27 slides
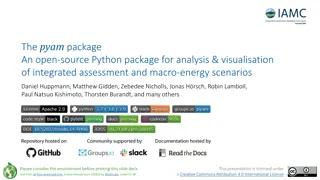
Overview of the pyam Package for Integrated Assessment and Macro-Energy Scenarios
The pyam package is an open-source Python tool for analysis and visualization of integrated assessment and macro-energy scenarios. Developed by a team of contributors, it provides a workflow from model to insight, supporting various data models and file formats. With features for data processing, va
0 views • 5 slides
Interactive Data Visualization Tools and Techniques Quiz
This quiz tests knowledge on data visualization tools, techniques, and concepts. Questions cover topics such as the use of EDA in data visualization, interactive graph outputs, historical figures in data visualization, GIS data types in SAS/JMP, outlier detection in 3D scatterplots, and limitations
1 views • 11 slides
Enhancing Classmate's Data Visualization for Homework Assignment 2
Explore the process of applying a classmate's data visualization code to your own data for Homework Assignment 2. Critique the effectiveness of the visualization in conveying the intended point and offer suggestions for improvement if necessary. Follow the steps outlined to submit your completed ass
0 views • 4 slides
Evolution of Communication: From In-Person Cons to Modern Chat Platforms
Delve into the historical perspective of communication methods and witness the shift from in-person synchronous conversations to the asynchronous and versatile chat platforms of today. Explore the pros and cons of various communication mediums along the timeline, highlighting the significance of cur
0 views • 19 slides
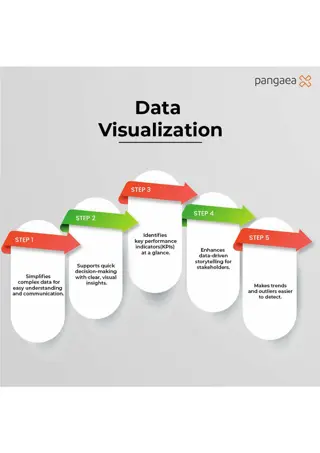
Maximize Business Impact with Data Visualization
This infographic shows how data visualization simplifies complex data, supports decision-making, highlights KPIs, and enhances data-driven storytelling. Its an essential tool for identifying trends and outliers. Discover expert data visualization talent at Pangaea X by visiting www.pangaeax.com.
7 views • 1 slides
Data Visualization Presentations Collection
Collection of various image slides containing charts, graphs, and data visualization elements. The slides showcase different types of visual representations such as bar graphs, line charts, percentages, and more. Each slide provides a unique visualization, making it a diverse collection for presenta
0 views • 13 slides
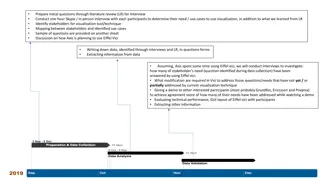
Effective Stakeholder Interviews for Visualization Tool Improvement
Conducting in-depth interviews with stakeholders is crucial for identifying their needs and use cases for visualization tools. By asking targeted questions and analyzing responses, insights can be gained to enhance the current visualization technique, like Eiffel Vici. The process involves mapping s
0 views • 5 slides
WhatsApp Chat Button How to Add WhatsApp Chat Widget to Website
The WhatsApp chat button shows your commitment to innovation and new technologies. Incorporating a WhatsApp chat button on your website is an effective strategy to improve communication with your customers.
4 views • 11 slides
WhatsApp Chat Button How to Add WhatsApp Chat Widget to Website
The WhatsApp chat button shows your commitment to innovation and new technologies. Incorporating a WhatsApp chat button on your website is an effective strategy to improve communication with your customers.
1 views • 11 slides
ChronoChat: A Serverless Multi-User Chat System Based on ChronoSync Over NDN
Introduction to ChronoChat, a serverless multi-user chat application utilizing ChronoSync over Named Data Networking (NDN) architecture. Discusses synchronization methods, handling complex scenarios, and design considerations. Compares with traditional chat applications like IRC and P2P chat. Explai
0 views • 22 slides
Real-Time Data Visualization for Combatting COVID-19 Challenges
Utilizing just-in-time data and real-time data visualization methods to address key challenges posed by the COVID-19 pandemic, such as identifying high-risk individuals, monitoring quarantines, and combating misinformation. Interventions include data entry tools, chat bots, and integration of variou
1 views • 11 slides
Enhancing Data Visualization Community Engagement through Viz and Tell Sessions
This resource outlines a model for building a critical community focused on data visualization, offering Viz and Tell/Coffee Break sessions to encourage engagement and learning. Topics covered include visualization instruction, tools, ethics, data journalism, and more. The model emphasizes open disc
0 views • 6 slides
Importance of Data Visualization in Network Management
Data visualization plays a crucial role in understanding and extracting value from data, especially in the realm of network management. Visualization techniques enable better decision-making, pattern recognition, and storytelling with data. By exploring data through visualization tools, one can unco
0 views • 26 slides
Ask On Data Open Source GenAI-Powered Chat-Based Data Engineering Tool
In today\u2019s data-driven world, organizations are increasingly turning to GenAI (Generative AI) and LLMs (Large Language Models) to streamline their data engineering processes. One innovative tool that is revolutionizing data management is Ask On
0 views • 3 slides
Free Chat With Astrologer To Resolve Your Love Career And Life Issues
AstroManch offers a free chat with astrologers to resolve your love, career, and life issues. Get expert guidance and accurate predictions to navigate challenges. Connect now for instant insights!\n\n\/\/blunturi.org\/free-chat-with-astrologer-to-res
0 views • 6 slides
Top 5 Open Source Data Visualization Tools
This blog explores the top 5 open source data visualization tools that are transforming the way we interpret data. Whether you're a data analyst, developer, or business professional, these tools can help you unlock the power of data visualization.
0 views • 5 slides

