Graph Machine Learning Overview: Traditional ML to Graph Neural Networks
Explore the evolution of Machine Learning in Graphs, from traditional ML tasks to advanced Graph Neural Networks (GNNs). Discover key concepts like feature engineering, tools like PyG, and types of ML tasks in graphs. Uncover insights into node-level, graph-level, and community-level predictions, an
3 views • 87 slides
Understanding Data Visualization with Matplotlib in Python
Matplotlib is a powerful Python package for data visualization, offering both an integrated interface (pyplot) and a native object-oriented interface. This tool enables users to create various types of plots and gives control over the visualization process. Learn about basic operations, differences
6 views • 19 slides
Open Source Chat Based Data Visualization With Helical Insight
Open Source Chat Based Data Visualization plays a pivotal role in modern business operations, enabling organizations to derive insights, make informed decisions, and drive growth. However, traditional visualization tools often come with high costs and steep learning curves, limiting accessibility an
1 views • 2 slides
Localised Adaptive Spatial-Temporal Graph Neural Network
This paper introduces the Localised Adaptive Spatial-Temporal Graph Neural Network model, focusing on the importance of spatial-temporal data modeling in graph structures. The challenges of balancing spatial and temporal dependencies for accurate inference are addressed, along with the use of distri
3 views • 19 slides
Graph Neural Networks
Graph Neural Networks (GNNs) are a versatile form of neural networks that encompass various network architectures like NNs, CNNs, and RNNs, as well as unsupervised learning models such as RBM and DBNs. They find applications in diverse fields such as object detection, machine translation, and drug d
2 views • 48 slides
Understanding Neo4j Graph Database Fundamentals
This comprehensive presentation delves into the fundamentals of Neo4j graph database, covering topics such as the definition of graph databases, reasons for their usage, insights into Neo4j and Cypher, practical applications like data flow analysis, and hands-on instructions on creating and querying
0 views • 20 slides
Benefits of Open Source Chat-based Data Visualization
In the realm of Business Intelligence (BI), data visualization plays a pivotal role in transforming raw data into actionable insights. Traditional BI tools often require users to possess technical expertise in querying databases and creating visualizations. However, the emergence of open source chat
1 views • 2 slides
Open Source Alternative to Tableau for Data Visualization in 2024
As businesses increasingly rely on data-driven decisions, the demand for powerful data visualization tools continues to grow. Tableau has long been a leader in this space, known for its robust capabilities and user-friendly interface. However, open-source alternatives are gaining traction due to the
0 views • 2 slides
Exploring Graph-Based Data Science: Opportunities, Challenges, and Techniques
Graph-based data science offers a powerful approach to analyzing data by leveraging graph structures. This involves using graph representation, analysis algorithms, ML/AI techniques, kernels, embeddings, and neural networks. Real-world examples show the utility of data graphs in various domains like
3 views • 37 slides
Reusing Phylogenetic Data for Enhanced Visualization and Analysis
Reusing phylogenetic data can revolutionize scientific research by enabling synthesis of knowledge and comparative analyses across scientific disciplines. However, a significant portion of valuable phylogenetic data is lost due to the prevalent use of static images for tree publication. To address t
0 views • 8 slides
Understanding Wind Tunnels: Devices for Aerodynamic Testing
Wind tunnels are devices that simulate air flows to test models under controlled conditions. They are classified as low-speed and high-speed tunnels, used to replicate flying or moving objects. Testing involves studying air motion using techniques like smoke visualization, colored threads, and speci
2 views • 37 slides
Interactive Plotting with ggplot and Shiny: Enhancing Galaxy Visualization Tools
Explore the concept of transforming existing ggplot2 Galaxy tools into interactive platforms using Shiny or Plotly implementations. Discover a variety of plot types available with ggplot2, such as barplots, violin plots, PCA plots, and heatmaps. Utilize additional plot options through various geom_*
2 views • 9 slides
Exploring Deep Graph Theory: Philosophical Implications and Misconceptions
Delve into the realm of Deep Graph Theory where graph theory statements are analyzed beyond their conventional scope to uncover philosophical insights and correct misunderstandings. Discover the essence of trees, forests, and the unique relationship where every tree is regarded as a forest. Addition
0 views • 13 slides
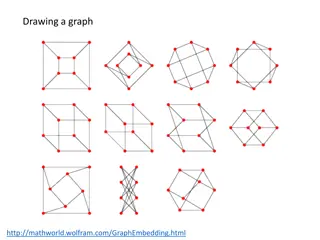
Understanding Graph Theory Fundamentals
Delve into the basics of graph theory with topics like graph embeddings, graph plotting, Kuratowski's theorem, planar graphs, Euler characteristic, trees, and more. Explore the principles behind graphs, their properties, and key theorems that define their structure and connectivity.
0 views • 17 slides
EEG Conformer: Convolutional Transformer for EEG Decoding and Visualization
This study introduces the EEG Conformer, a Convolutional Transformer model designed for EEG decoding and visualization. The research presents a cutting-edge approach in neural systems and rehabilitation engineering, offering advancements in EEG analysis techniques. By combining convolutional neural
1 views • 6 slides
Association Rules with Graph Patterns: Exploring Relationships in Data
Dive into the world of association rules with graph patterns, where relationships and connections are analyzed through nodes and edges. Discover how to define association rules, identify customers, and uncover interesting patterns using graph-based techniques. Explore traditional and graph-pattern a
2 views • 18 slides
Solving the Professors to Coffee Lounge Problem: A Graph Theory Approach
An intriguing mathematical problem is presented where new faculty members at TIMS must be assigned to coffee lounge alcoves in a way that ensures no two new members meet after the first day. By constructing a graph based on meet-up timings, analyzing clashes, and determining intervals, this scenario
1 views • 19 slides
Exploring the Impact of Randomness on Planted 3-Coloring Models
In this study by Uriel Feige and Roee David from the Weizmann Institute, the effect of randomness on planted 3-coloring models is investigated. The research delves into the NP-hard nature of 3-coloring problems, introducing a hosted coloring framework that involves choices like the host graph and th
0 views • 55 slides
Design and Evaluation in Visualization Techniques
Understanding the importance of formal evaluations in visualization techniques, this material covers a range of evaluation methods including empirical and analytic approaches such as usability tests, controlled experiments, and expert reviews. It delves into the scientific method of hypothesis forma
1 views • 41 slides
Managing Large Graphs on Multi-Cores with Graph Awareness
This research discusses the challenges in managing large graphs on multi-core systems and introduces Grace, an in-memory graph management and processing system with optimizations for graph-specific and multi-core-specific operations. The system keeps the entire graph in memory in smaller parts and p
0 views • 14 slides
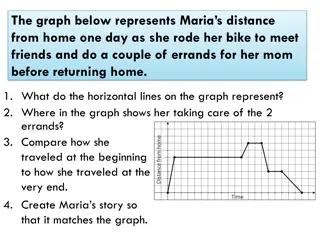
Maria's Bike Journey Graph Analysis
Maria's bike journey graph depicts her distance from home as she rode to meet friends and run errands before returning home. The graph shows her stops for errands, changes in direction, and her path back home. By interpreting the key features of the graph, such as intercepts and intervals, we can an
0 views • 15 slides
Multidimensional Icons in Data Visualization Solutions
This collection showcases various types of visual icons used in data visualization to represent values of different variables, such as categorical, quantitative, and Boolean data. Each icon summarizes specific information for a given item in a collection, ranging from nominal and ordinal data to the
0 views • 9 slides
Balanced Graph Edge Partition and Its Practical Applications
Balanced graph edge partitioning is a crucial problem in graph computation, machine learning, and graph databases. It involves partitioning a graph's vertices or edges into balanced components while minimizing cut costs. This process is essential for various real-world applications such as iterative
0 views • 17 slides
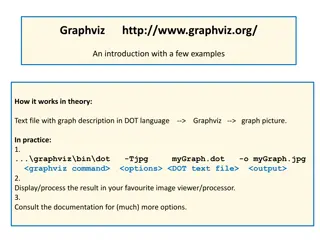
Introduction to Graphviz: A Powerful Visualization Tool
Graphviz is a versatile tool used to create visual representations of graphs by describing them in the DOT language. The process involves writing a text file with the graph description, using Graphviz to generate the graph picture, and then viewing or processing the output. It provides a detailed in
0 views • 10 slides
Enhancing Safety in Navigation Through Improved Data Quality Visualization
The IHO Data Quality Working Group focuses on classifying and depicting the quality of digital hydrographic information to ensure safe navigation. The group addresses the need for clear warnings on ECDIS displays regarding poor-quality survey data. Despite progress in developing visualization method
0 views • 34 slides
Understanding Spanning Trees and Minimum Spanning Trees
Explore the concept of spanning trees and minimum spanning trees in graph theory through an in-depth lecture outline covering topics like Cut Property, Cycle Property, Kruskal's Algorithm, and more. Delve into the significance of Minimum Spanning Trees (MSTs) as the lowest-cost spanning tree of a gr
1 views • 41 slides
Software Design Patterns for Information Visualization
Explore design patterns for information visualization interfaces, understand the complexities, and leverage tools like Google API. Learn about different software design patterns, categories of patterns for information visualization, and the relationships between them. Discover the reference model fo
0 views • 27 slides
Graph Pattern Matching Challenges and Solutions
Graph pattern matching in social networks presents challenges such as costly queries, excessive results, and query focus issues. The complexity of top-k and diversified pattern matching problems requires heuristic algorithms for efficient solutions. Finding best candidates for project roles involves
0 views • 19 slides
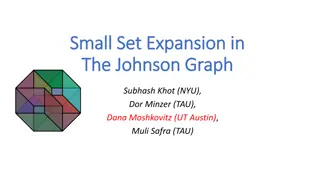
Understanding Small Set Expansion in Johnson Graphs
In this detailed piece, Subhash Khot, Dor Minzer, Dana Moshkovitz, and Muli Safra explore the fascinating concept of Small Set Expansion in Johnson Graphs. The Johnson Graph is defined as a representation where nodes are sets of size K in a universe of size N, and two sets are connected if they inte
0 views • 14 slides
Vertex-Centric Programming for Graph Neural Networks
Seastar presents a vertex-centric programming approach for Graph Neural Networks, showcasing better performance in graph analytic tasks compared to traditional methods. The research introduces the SEAStar computation pattern and discusses GNN programming abstractions, execution, and limitations. Dee
0 views • 17 slides
Interactive Data Visualization Tools and Techniques Quiz
This quiz tests knowledge on data visualization tools, techniques, and concepts. Questions cover topics such as the use of EDA in data visualization, interactive graph outputs, historical figures in data visualization, GIS data types in SAS/JMP, outlier detection in 3D scatterplots, and limitations
0 views • 11 slides
Graph Property Testing and Algorithms Overview
Explore testable bounded degree graph properties, sparse graphs, d-bounded degree graphs, hyperfinite graphs, arboricity, maximum matching algorithms, and sublinear time approximation algorithms in graph data streams. Learn about various graph models and properties with examples, showcasing the impo
0 views • 53 slides
Understanding Graph Modeling and DFS Applications
Explore the world of graph modeling and DFS applications through lectures on graph vocabulary, edge classification in directed graphs, and the use of DFS to find cycles. Discover the significance of tree edges, back edges, forward edges, and cross edges in graph traversal. Learn how DFS can be utili
0 views • 32 slides
Graph-Based Knowledge Representation in Modelling: A Comprehensive Overview
This content delves into graph-based knowledge representation in modelling, detailing concepts such as recipe-ingredient relationships, formalisms for generalizing graph representation, and conceptual graphs by John F. Sowa. It explores how different interpretations describe the association between
0 views • 19 slides
Understanding Graph Databases and Neo4j
Graph databases offer a flexible way to manage data by representing relationships between nodes. Neo4j is a popular graph database system that uses Cypher for querying. This guide provides insights into graph database concepts, advantages, and getting started with Neo4j, including creating nodes and
0 views • 39 slides
Solving Train Track Problems Using Interval Graphs and Graph Coloring
Presented by Manvitha Nellore, this content addresses real-world train track problems in busy cities by proposing solutions through interval graphs and graph theory. The approach involves allotting tracks to trains by scheduling with time intervals to avoid conflicts. An interval graph is defined, a
0 views • 15 slides
Data Processing and Analysis for Graph-Based Algorithms
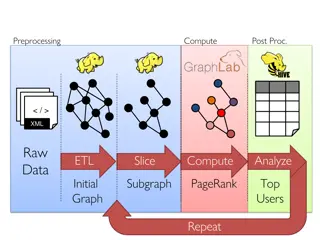
This content delves into the preprocessing, computing, post-processing, and analysis of raw XML data for graph-based algorithms. It covers topics such as data ETL, graph analytics, PageRank computation, and identifying top users. Various tools and frameworks like GraphX, Spark, Giraph, and GraphLab
0 views • 8 slides
Understanding Graph Algorithms for Connectivity and Shortest Paths
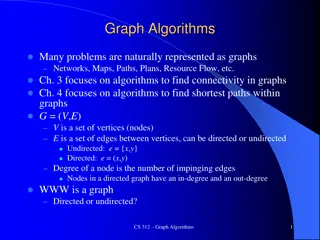
Graph algorithms play a crucial role in solving problems represented as networks, maps, paths, plans, and resource flow. This content delves into ways to find connectivity in graphs and algorithms for determining shortest paths. It discusses graph representations using adjacency matrices and lists,
1 views • 32 slides
Insights into Cliques and Independent Sets in Graph Theory
Exploring the concepts of cliques, independent sets, and theorems in graph theory regarding enemy relationships, maximum number of edges in 3-free graphs, and properties of multipartite graphs. The propositions and theorems discussed shed light on graph structures and their properties, providing val
0 views • 32 slides
Importance of Data Visualization in Network Management
Data visualization plays a crucial role in understanding and extracting value from data, especially in the realm of network management. Visualization techniques enable better decision-making, pattern recognition, and storytelling with data. By exploring data through visualization tools, one can unco
0 views • 26 slides
